Chapter 6 How to Operate Sampling Scope
6-10
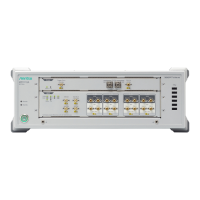
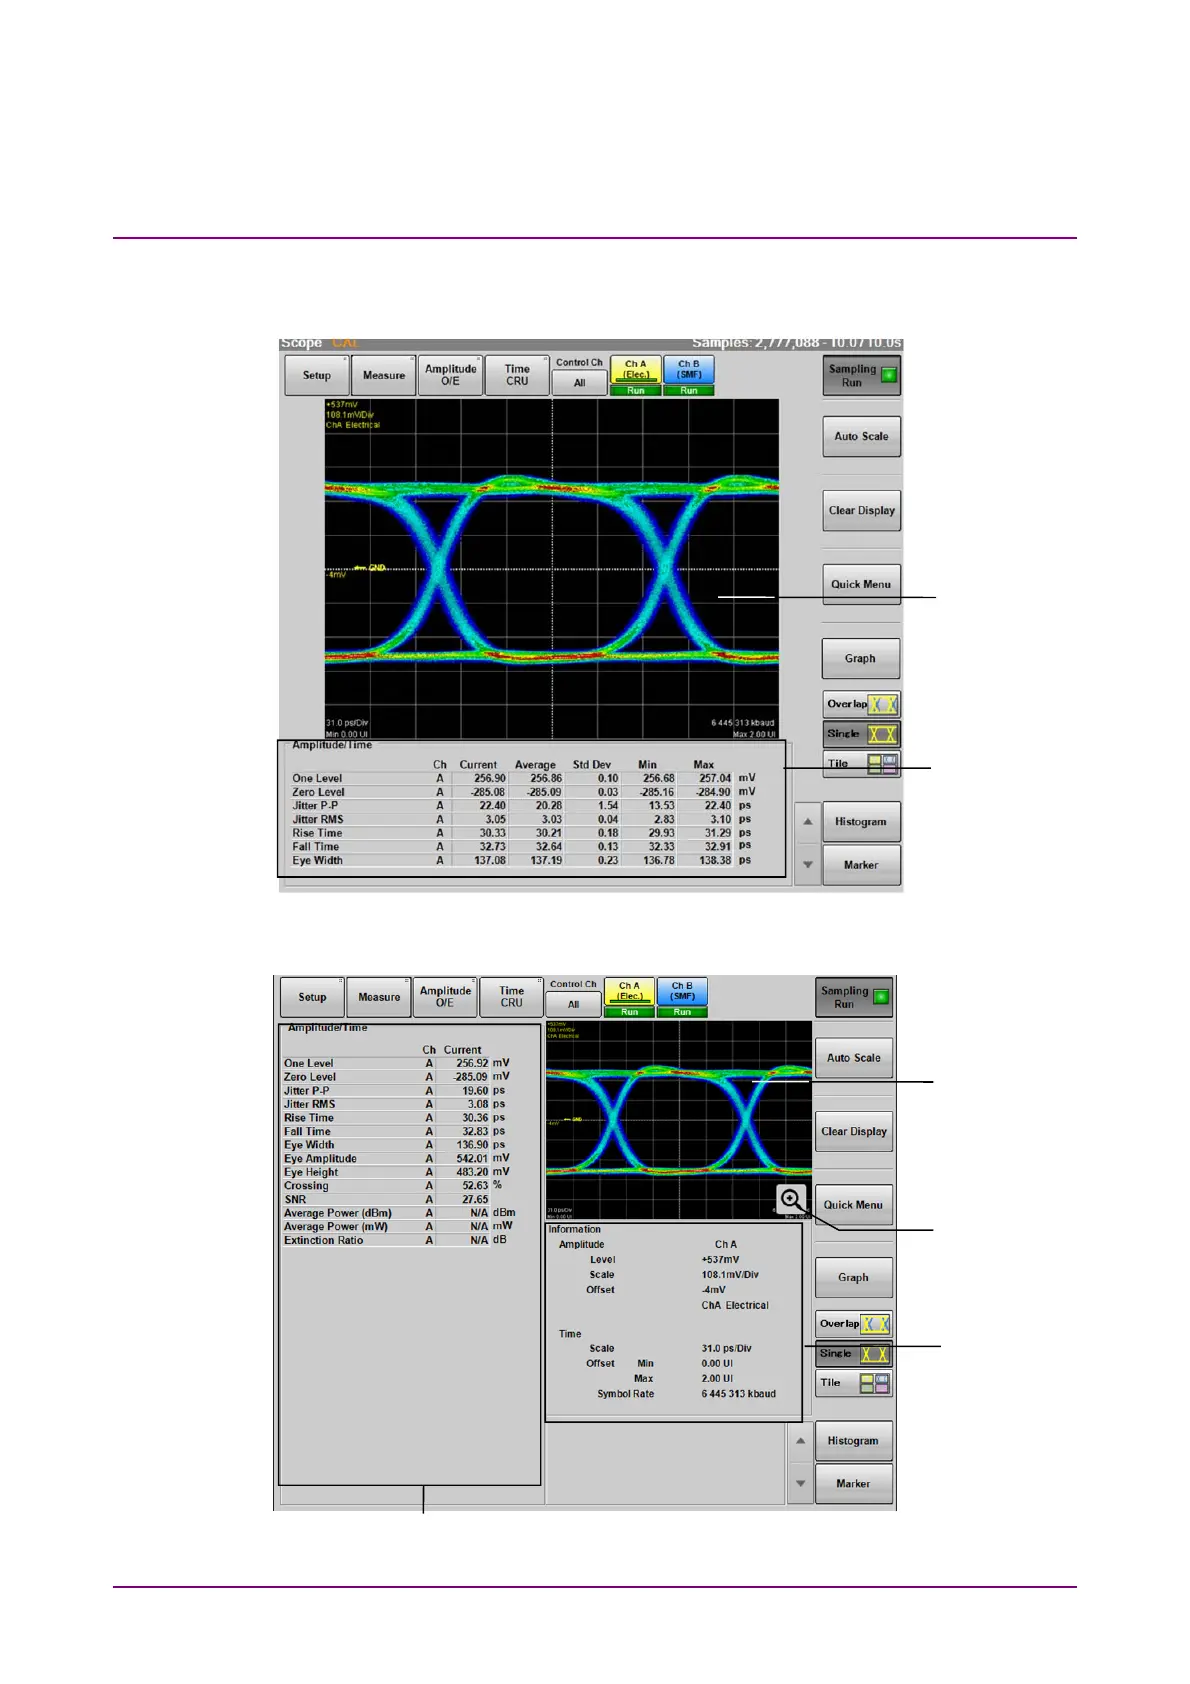
The graph size changes depending on the number of measurement results
displayed on Result Window.
Figure 6.2.1-9 Result Window (Number of measurement items is from five to eight)
Figure 6.2.1-10 Result Window (Number of measurement items is nine or more)
Waveform
display area
Measurement
result display
area
Zoom
display
Waveform
display
area
Waveform
information
display area
Measurement result display area
 Loading...