6.2 Explanation of Windows
6-21
6
How to Operate Sampling Scope
RJ/PJ Histogram
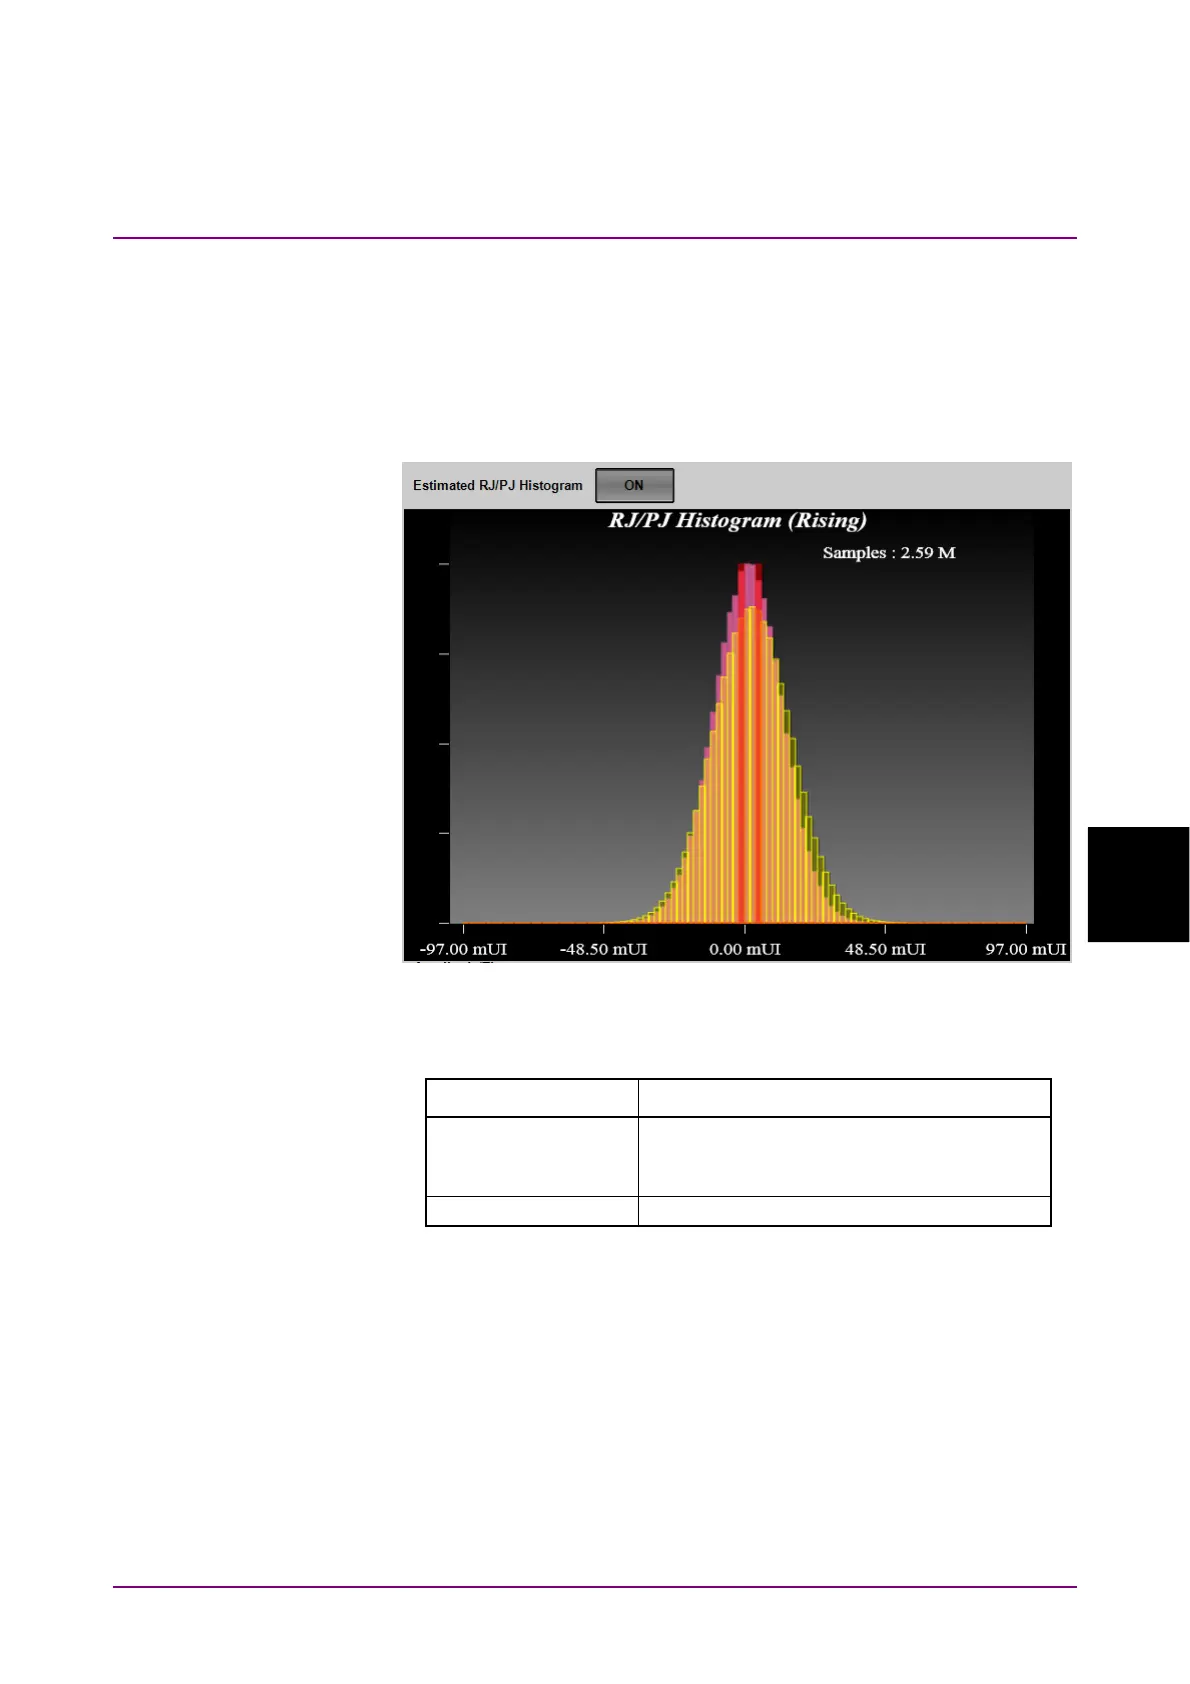
Clicking RJ/PJ Histogram on the Graph selection buttons, a histogram
that is the sum of RJ and PJ is displayed.
When Estimate RJ / PJ Histogram is set to ON, histogram of RJ
approximated by dual Dirac function is displayed in yellow and amplitude
of PJ is displayed in red line.
Figure 6.2.2.2-3 RJ/PJ Histogram
Table 6.2.2.2-3 RJ/PJ Histogram Item
Name Description
Estimate RJ/PJ
Histogram
Switches the histogram display for RJ and
PJ estimated with dual dirac function.
PJ amplitude is displayed with red lines.
Samples The number of samples for the histogram