6.2 Explanation of Windows
6-25
6
How to Operate Sampling Scope
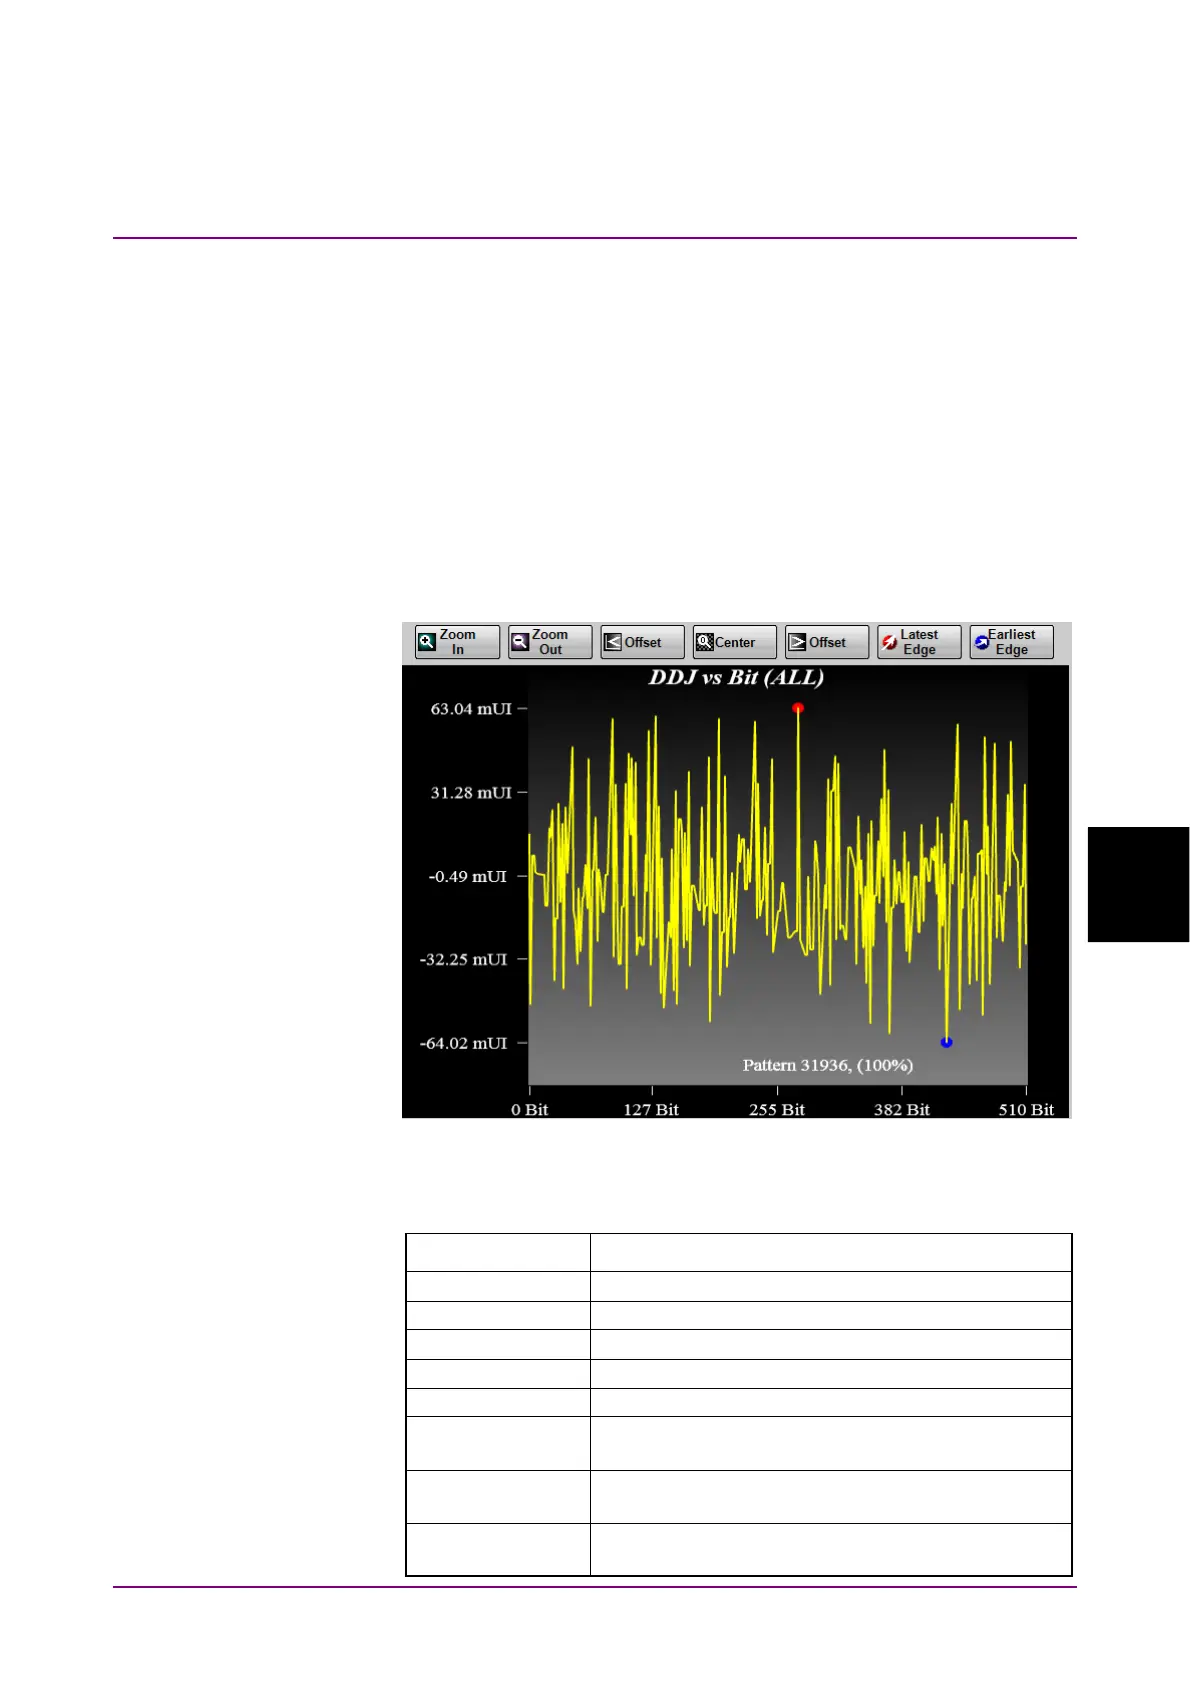
DDJ vs Bit
When clicking DDJ vs Bit on the Graph selection buttons, Pattern, and
DDJ graph are displayed.
Notes:
If PDJ measurement is ON, DDJ vs Bit changes to PDJ vs Bit.
When the display range on the horizontal axis is 193 bits or
more, the pattern graph (white line) is not displayed.
A red circle is displayed at the maximum position of the DDJ, and a blue
circle marker is displayed at the position where the DDJ is at the
minimum position.
Figure 6.2.2.2-7 DDJ vs Bit
Table 6.2.2.2-7 DDJ vs Bit Item
Name Description
Zoom In Makes the display range of the graph half.
Zoom Out Doubles the display range of the graph.
< Offset Moves the display area of the graph to the left.
Center Displays the entire range of the graph.
> Offset Moves the display area of the graph to the right.
Latest Edge Zooms in the location with the maximum jitter
amount.
Earliest Edge
Zooms in the location with the minimum jitter
amount.
Pattern Displays the number of measured patterns and
acquisition rate.