Chapter 7 Performance Test
7-40
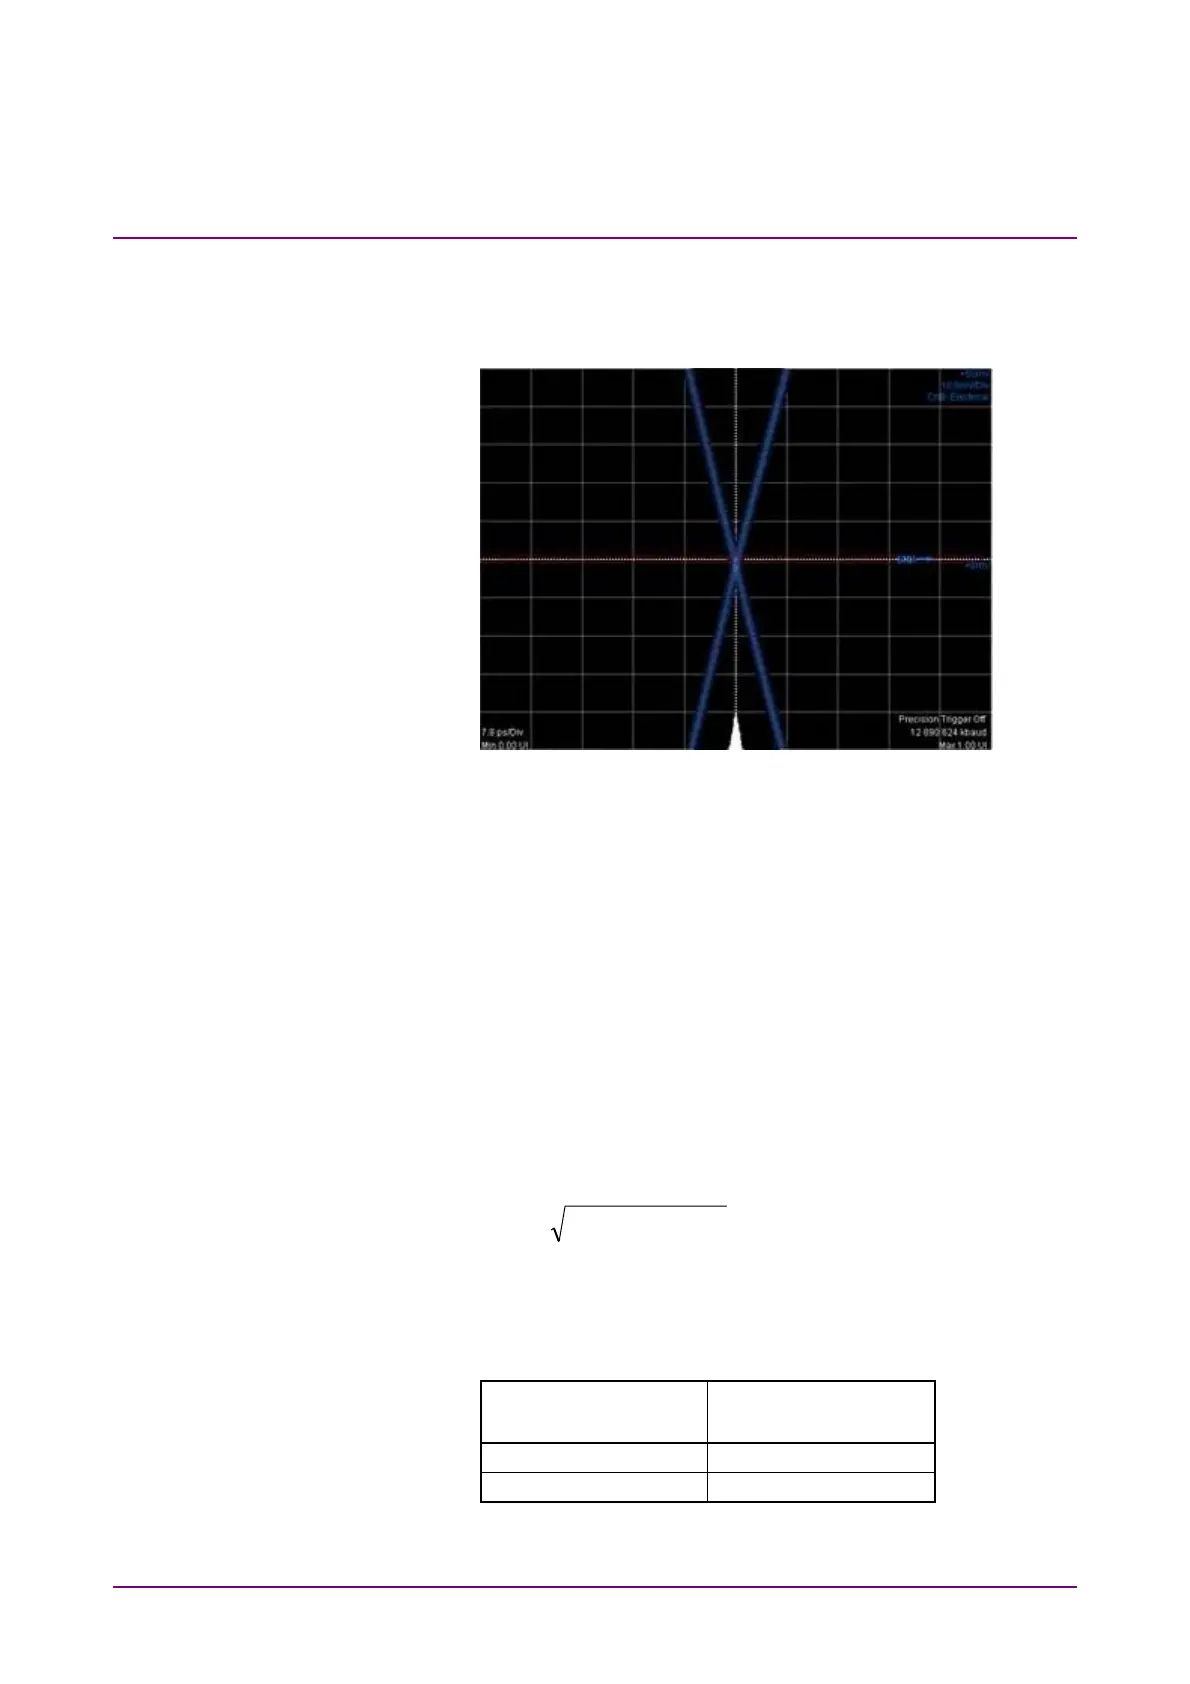
7. Click Ch A of Scope to display the graph.
8. Adjust Software Delay in Time Scale/Offset tab so that the cross
point is displayed at center of the window.
9. Write down the jitter RMS measurement value. The jitter RMS
measurement value is the std Dev value for Histogram.
10. Connect the
Clk Out
connector and the
CRU In
connector using a
coaxial cable. Refer to Figure 7.3.4-2 (b).
11. Connect the
CRU Out
connector and the
Ch A In
connector using
a coaxial cable. Refer to Figure 7.3.4-2 (b).
12. Click Time CRU of Scope and then click CRU tab.
13. Confirm Lock Status turning to Lock in Green.
14. Adjust Offset in Time -Scale/Offset tab so that the cross point is
displayed at center of the window.
15. Write down the jitter RMS measurement value. The jitter RMS
measurement value is the std Dev value for Histogram.
16. Calculate the added jitter J
Add
using the following formula.
22
PPGCRUAdd
JJJ
J
CRU
: Measured value in step 15.
J
PPG
: Measured value in step 9.
17. Change PPG1 Bit Rate and Scope Operation Rate to the
following values and repeat the step from 4 to 16.
PPG1 Bit Rate
Scope – CRU
Operation Rate
26 562 500 kbit/s 400GbE/8 (26.5625G)
28 050 000 kbit/s 32GFC (28.05G)
 Loading...