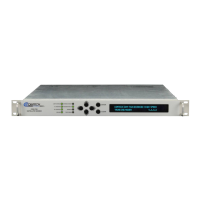
Front Panel Operation Revision 4
CDM-760 Advanced High-Speed Trunking Modem MN-CDM760
6–56
The frequency offset of the received carrier, in kHz, with a displayed step size of 100 Hz.
Rx-Level
A dBm reading indicating the signal level of the desired receive carrier, with a displayed step
size of 0.5dB.
6.2.3.5 (Monitor:) CnC (Carrier-in-Carrier Parameters)
CnC-Params: Freq-offset=-123.4kHz
Ratio:+1dB Delay=230.4ms
When enabled and locked, this read-only screen displays the CnC performance data:
• The Monitor: CnC screen refreshes once every second.
• CnC parameters must fall within the tolerances specified in Section 1.3.8 DoubleTalk
TM
Carrier-in-Carrier
®
(CnC).
• Ideal operation occurs when the CnC Ratio is 0 db. Ratios that are lower or higher –
approaching ±7 dB – will cause degradation. Ratios beyond ±7 dB may cause complete
unlock of circuit.
• The Delay in a properly working CnC link is typically between 230 ms and 290 ms. Delay
when bench-testing CnC operation is typically less than 100 µs.
6.2.3.6 (Monitor:) Stats (Statistics)
Statistics are reported for base unit operation only. M&C for the High-Speed Packet
Processor is provided on the CDM-760 HTTP Interface. See Chapter 7. ETHERNET
INTERFACE OPERATION for full information about using this interface for Packet
Processor operations.
IP BasebandFraming Compression
()
Use the arrow keys to select IP, BasebandFraming, or Compression. Press ENTER.
6.2.3.6.1 (Monitor: Stats) IP
IPstats: WAN Total Last10s ()
Bytes to WAN 0.0E+00 0.0E+00 Clr:N
An example of an IP statistics screen is shown here. Use the arrow keys on the top line to
select the IPstats port selection; then, on the bottom line, select the port-specific operational
statistics or the Clr: option.
(Monitor: Stats) IP View Statistics
First, on the top line – Use the arrow keys to select the IPstats: port:

 Loading...