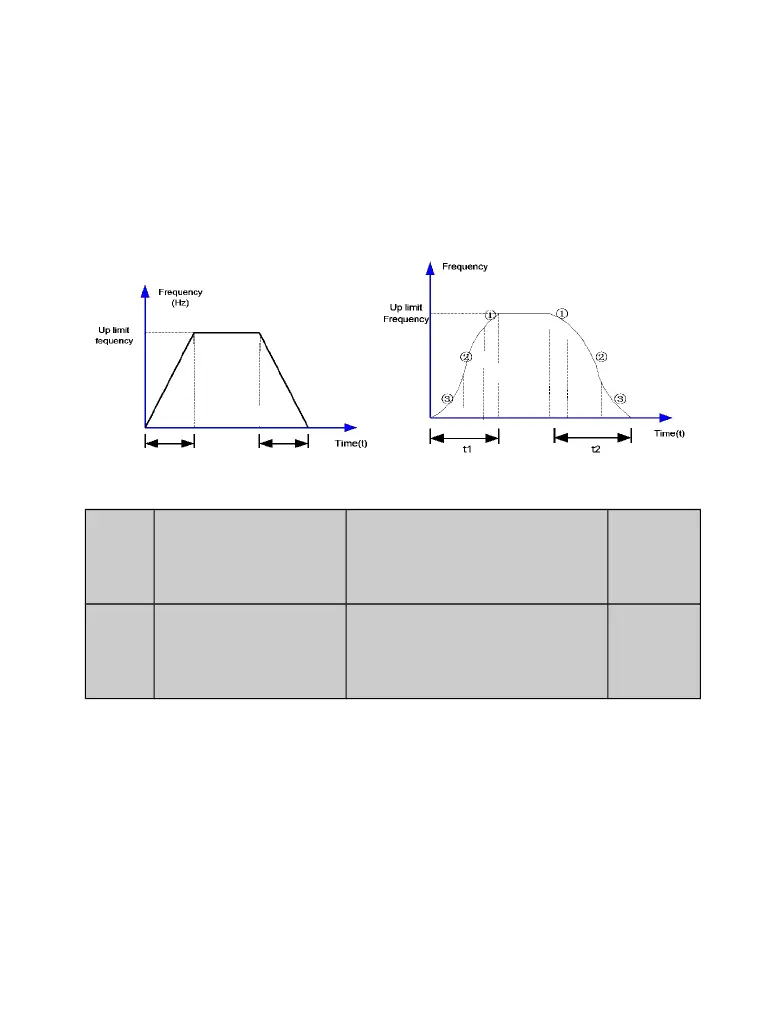
0: Linear acceleration/deceleration. The output frequency increases or decreases in
linear mode,showing in figure 6-3.
1: S-curve acceleration/deceleration. The output frequency increases or decreases along
the S curve, showing in figure 6-4.
Figure 6-3
Figure 6-4
P1.14
Time proportion of S-
curve start segment
Setting Range:10.0%~50.0%
(acceleration/deceleration
time),P0.14+P0.15<90%
30.0%
P1.15 Time proportion of S-
curve end segment
Setting Range:10.0%~80.0%
(acceleration/deceleration
time),P0.14+P0.15<90%
30.0%
These two parameters respectively define the time proportions of the start segment and the
end segment of S-curve acceleration/deceleration. They must satisfy the requirement:
P1.14+P1.15≤ 90.0%.
In Figure 6-4, ③ is the time defined in P1.14, within which the slope of the output frequency
change increases gradually. ①is the time defined in P1.15, within which the slope of the
output frequency change gradually decreases to 0. Within the time between ① and ③, the
slope of the output frequency change remains unchanged, that is, linear acceleration/