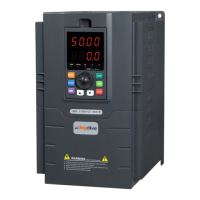
Figure 6-10 Diagram when the jump frequencies are valid during acceleration/deceleration
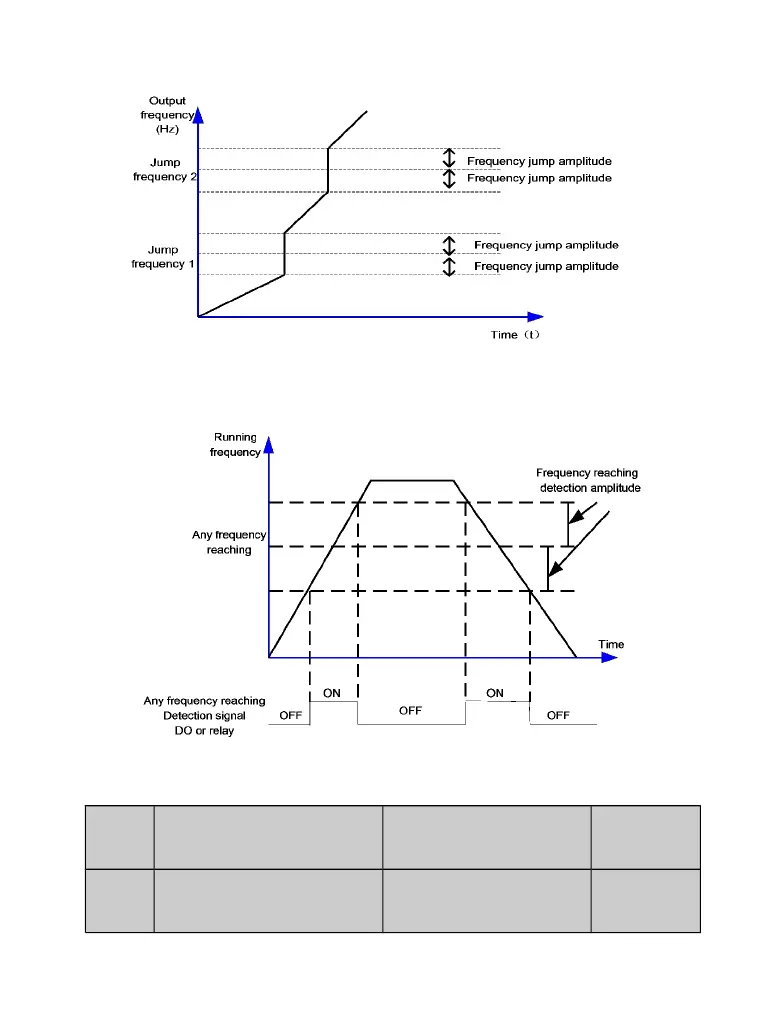
Figure 6-11 Diagram of any frequency reaching detection
P2.23
Frequency switchover point
between acceleration time 1
and acceleration time 2
Setting Range:0.00Hz~
maximum frequency
0.00Hz
P2.24
Frequency switchover point
between deceleration time 1
and deceleration time 2
Setting Range:0.00Hz~
maximum frequency
0.00Hz