INS
GUI User’s Manual
Inertial Labs, Inc
TM
Address: 39959 Catoctin Ridge Street, Paeonian Springs, VA 20129 U.S.A.
Tel: +1 (703) 880-4222, Fax: +1 (703) 935-8377 Website: www.inertiallabs.com
117
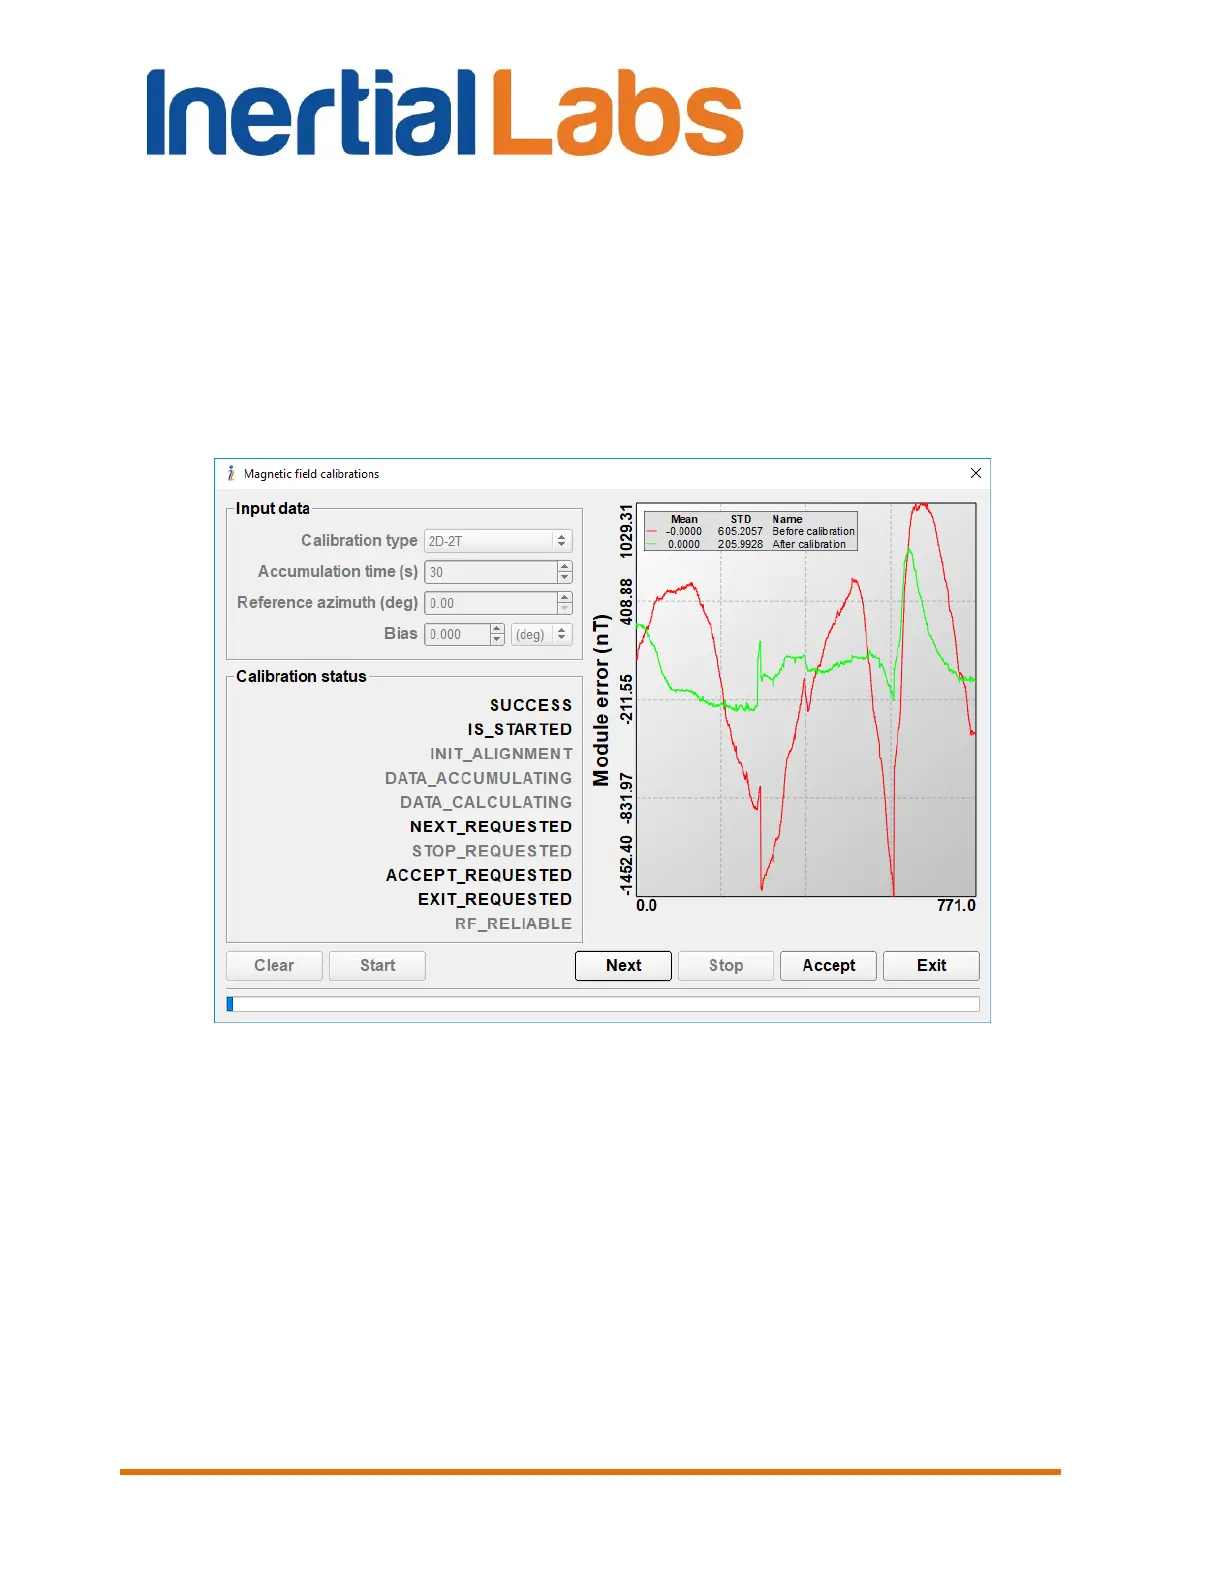
10.14 appears where graphs of errors before and after calibration are
shown. Plotted graphs are scalable. To zoom in please click and hold left
button on mouse and drag mouse in down-right direction. Click and hold
right button on mouse to shift plot. To zoom out please click and hold left
button on mouse and drag mouse in up-left direction. Legend is located at
the left upper corner of the tab. This legend shows mean value, STD and
name of displayed graphs. It is possible to select the graphs you want to
display by right-click on the graphs area.
Fig. 10.14
Step 10. Estimate the calibration quality. If the calibration was
successful and predicted heading accuracy is acceptable on window Fig.8.8
or captions “Excellent calibration!” or “Good calibration” appear in the
window Fig. 10.12, then click “Accept” button (Fig. 10.14) to accept
calibration parameters. “Acceptable calibration” caption is satisfactory too
but we recommend to recalibrate the INS.
There are two highlighted captions:
ACCEPT_REQUESTED – informs you can click “Accept” button to accept
calibration parameters;
 Loading...