6 ECG, Arrhythmia, ST and QT Monitoring
151
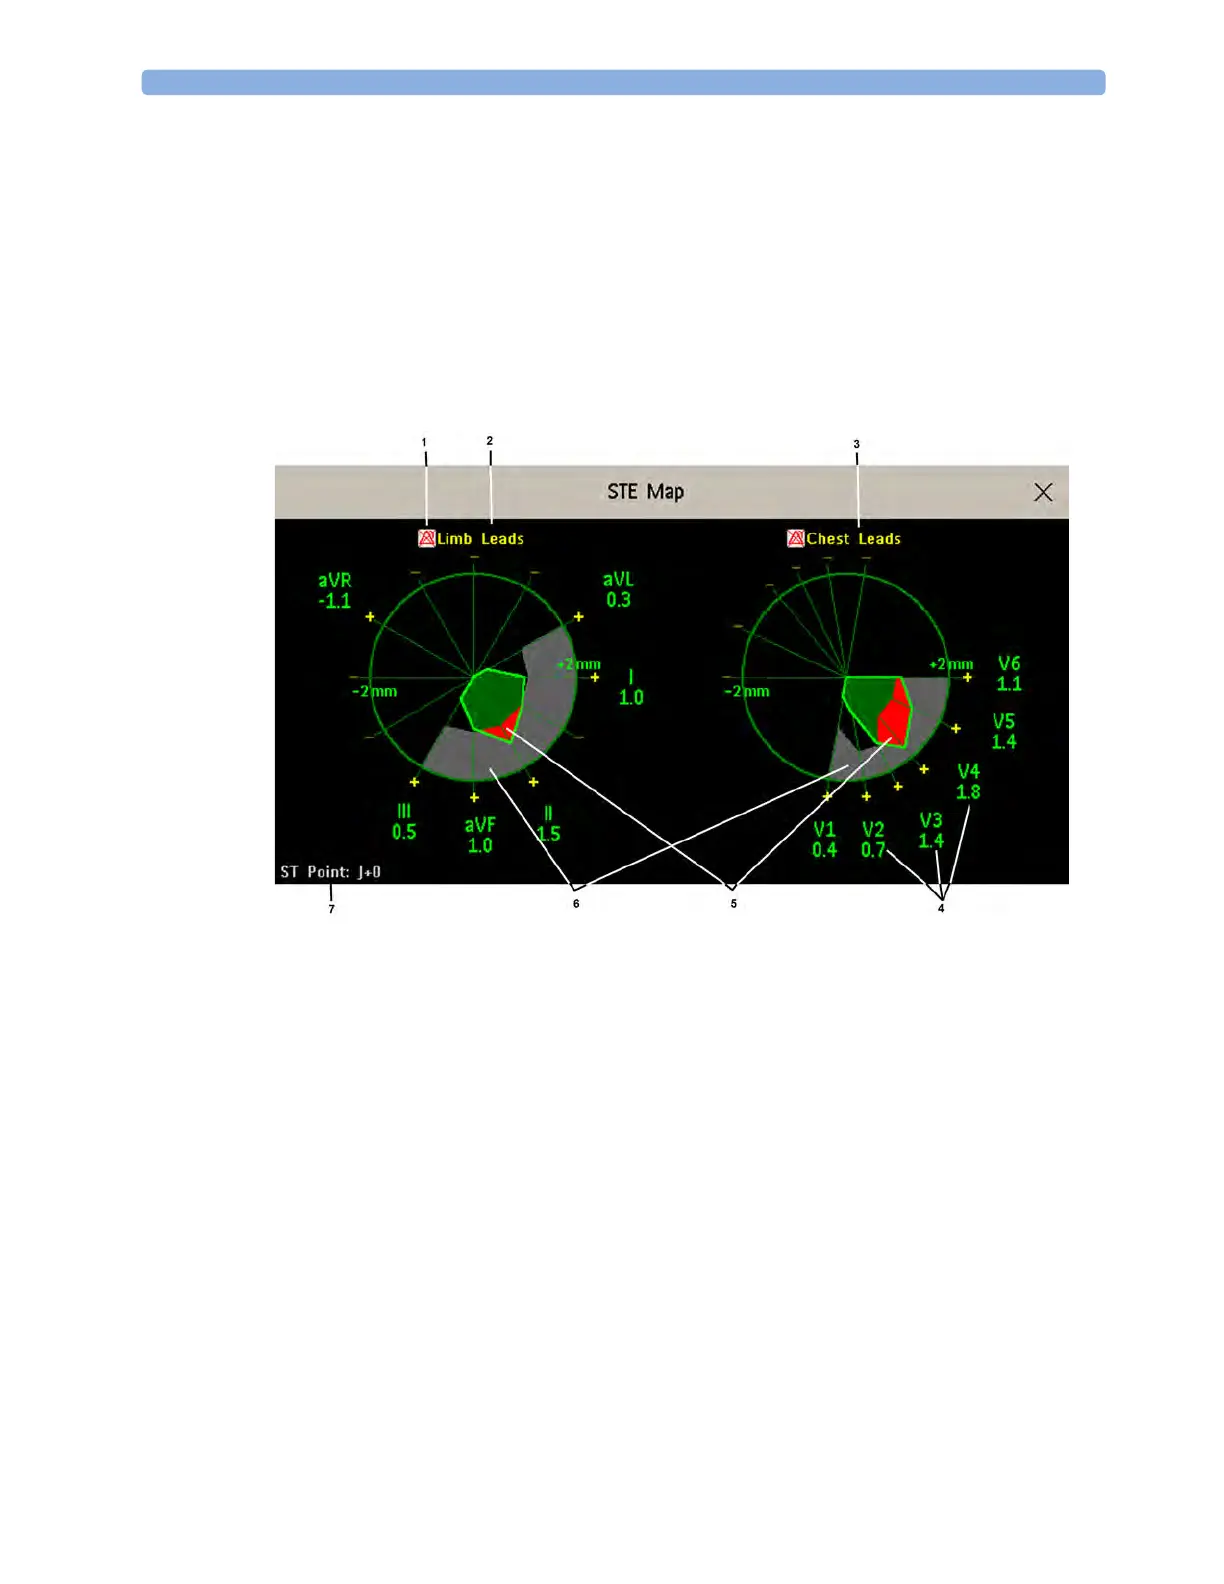
ECG leads. Each STE value is assigned to either a limb lead, or to a chest lead. Every axis shows the
polarity of the lead it represents. The STE limits are indicated by a gray colored area which contains all
values that lie above those limits. If the ECG parameter color is white, shades of green are used
instead.
If two contiguous leads exceed the corresponding STE limits, the violation area between the two STE
values and two corresponding limit values is colored in red. If the ECG parameter color is red, green is
used instead.
If the gender of the patient is not specified, the STE Map does not show any limits and does not
indicate any limit violations.
The STE Map does not provide Trend View or the ST baseline.
1 STE Alarm status indicator
2 Limb Leads
3 Chest Leads
4 Label, value and polarity of corresponding lead
5 STE Limit Violations
6 STE Limit Area
7 The position of the current ST measurement point (always J + 0)
Viewing an STE Map
To display an STE map,
•In the
Main Setup menu, select STE Map.
Working in the STE Map Task Window
You may need to activate the STE map task window to see all the data, and to access the pop-up keys.
Select the map view on screen to activate its task window. Once you activate it, you can perform the
tasks detailed here.