6 ECG, Arrhythmia, ST and QT Monitoring
152
Changing the Scale of the STE Map
To change scale,
•Select
Size Up or Size Down to alter the size at which monitor displays the map.
Printing an STE Map Report
To print the most recently viewed window,
1 Select Main Setup then select Reports.
2 Select STE Map.
3 Press Print.
Switching between STE Map and ST Map
If you are running ST Map or STE Map as an embedded screen application, you can switch back and
forth between STE Map and ST Map by selecting the
Change Map pop-up key.
Note that changes made here will be saved in the current screen.
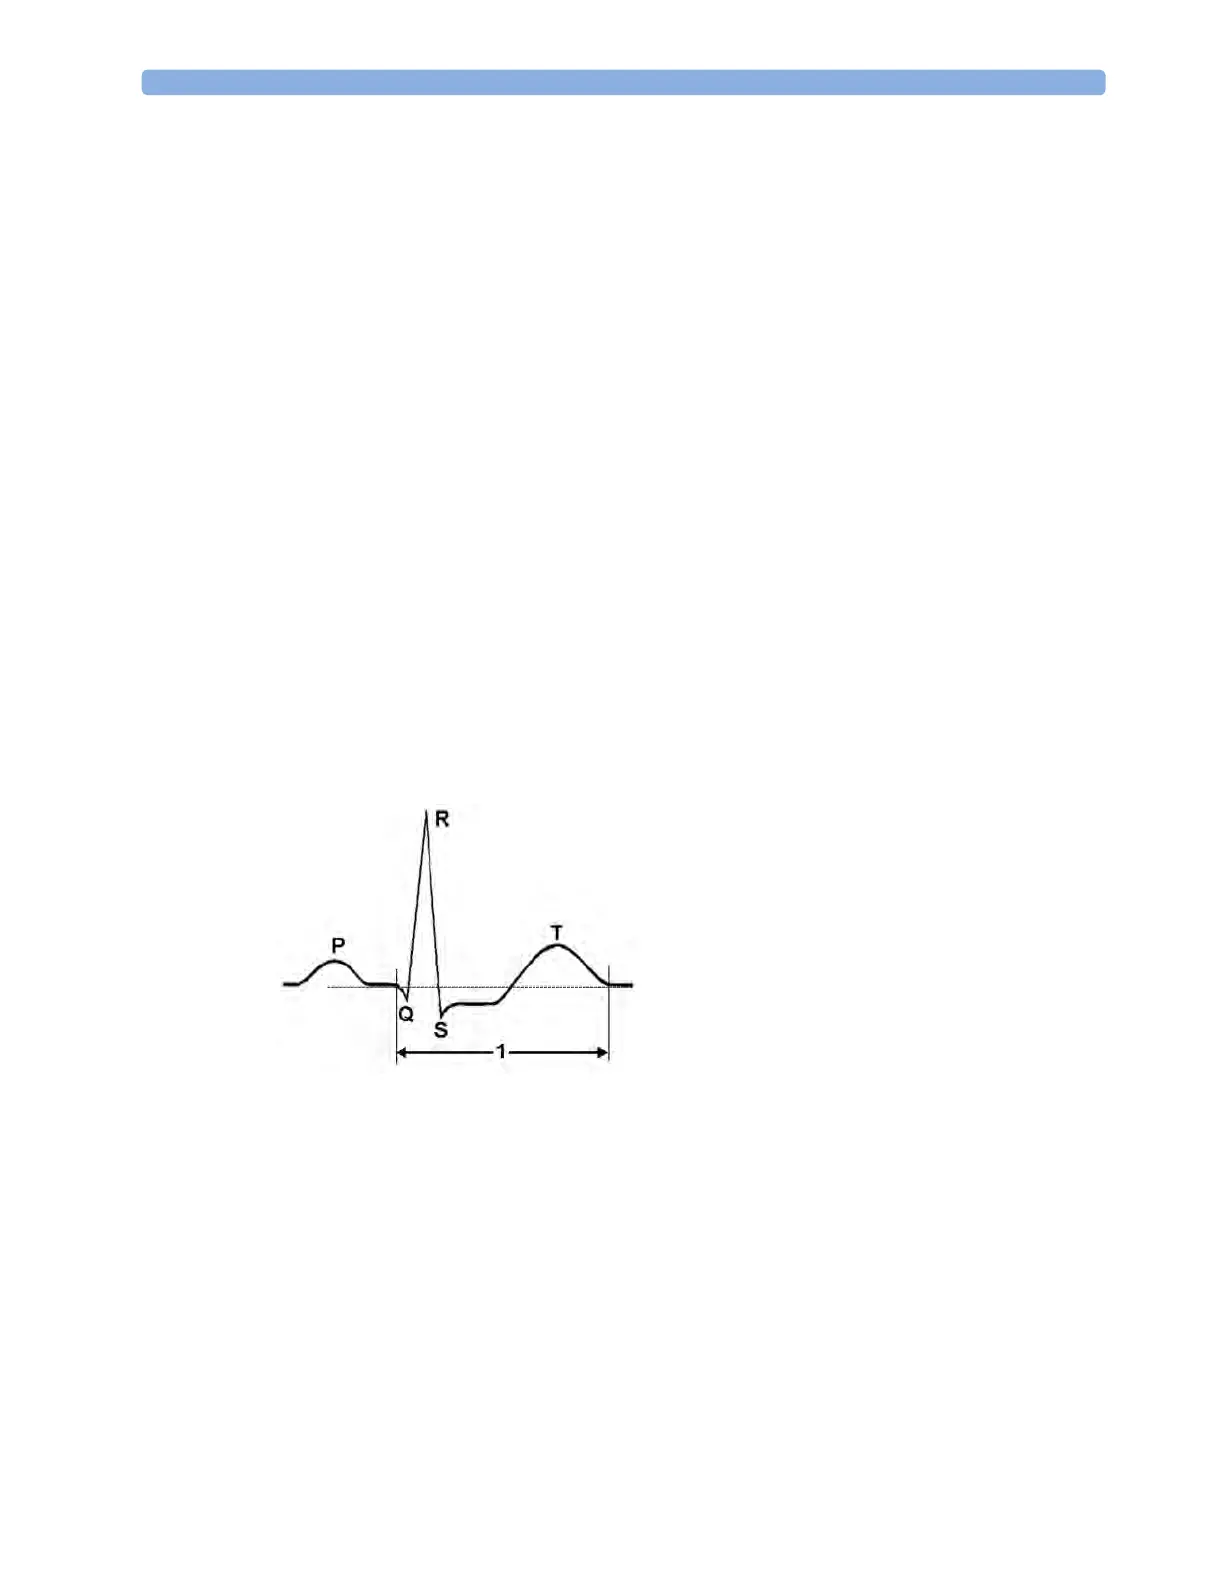
About QT/QTc Interval Monitoring
The QT interval is defined as the time between the beginning of the Q-wave and the end of the T-
wave. It measures the total duration of the depolarization (QRS duration) and repolarization (ST-T)
phases of the ventricular action potential. QT interval monitoring can assist in the detection of
prolonged QT interval syndrome.
The QT interval (1) has an inverse relationship to heart rate. Faster heart rates shorten the QT interval
and slower heart rates prolong the QT interval. Therefore there are several formulas used to correct
the QT interval for heart rate. The heart rate corrected QT interval is abbreviated as QTc. The monitor
uses as a default the Bazett correction formula and the alternative Fridericia formula can be selected in
Configuration Mode.
For QT interval monitoring to be effective, basic or enhanced arrhythmia monitoring should be turned
on.
QT Measurement Algorithm
The QT values are updated every five minutes except in the initial phase (first five minutes) where they
are updated once per minute. Normal or atrial paced beats and beats with a similar morphology are
averaged to form a representative waveform for further processing. Normal beats followed by a
premature QRS will be excluded from the measurements to prevent the premature beat from