Measurements and Results
R&S
®
FSVA3000/ R&S
®
FSV3000
264User Manual 1178.8520.02 ─ 01
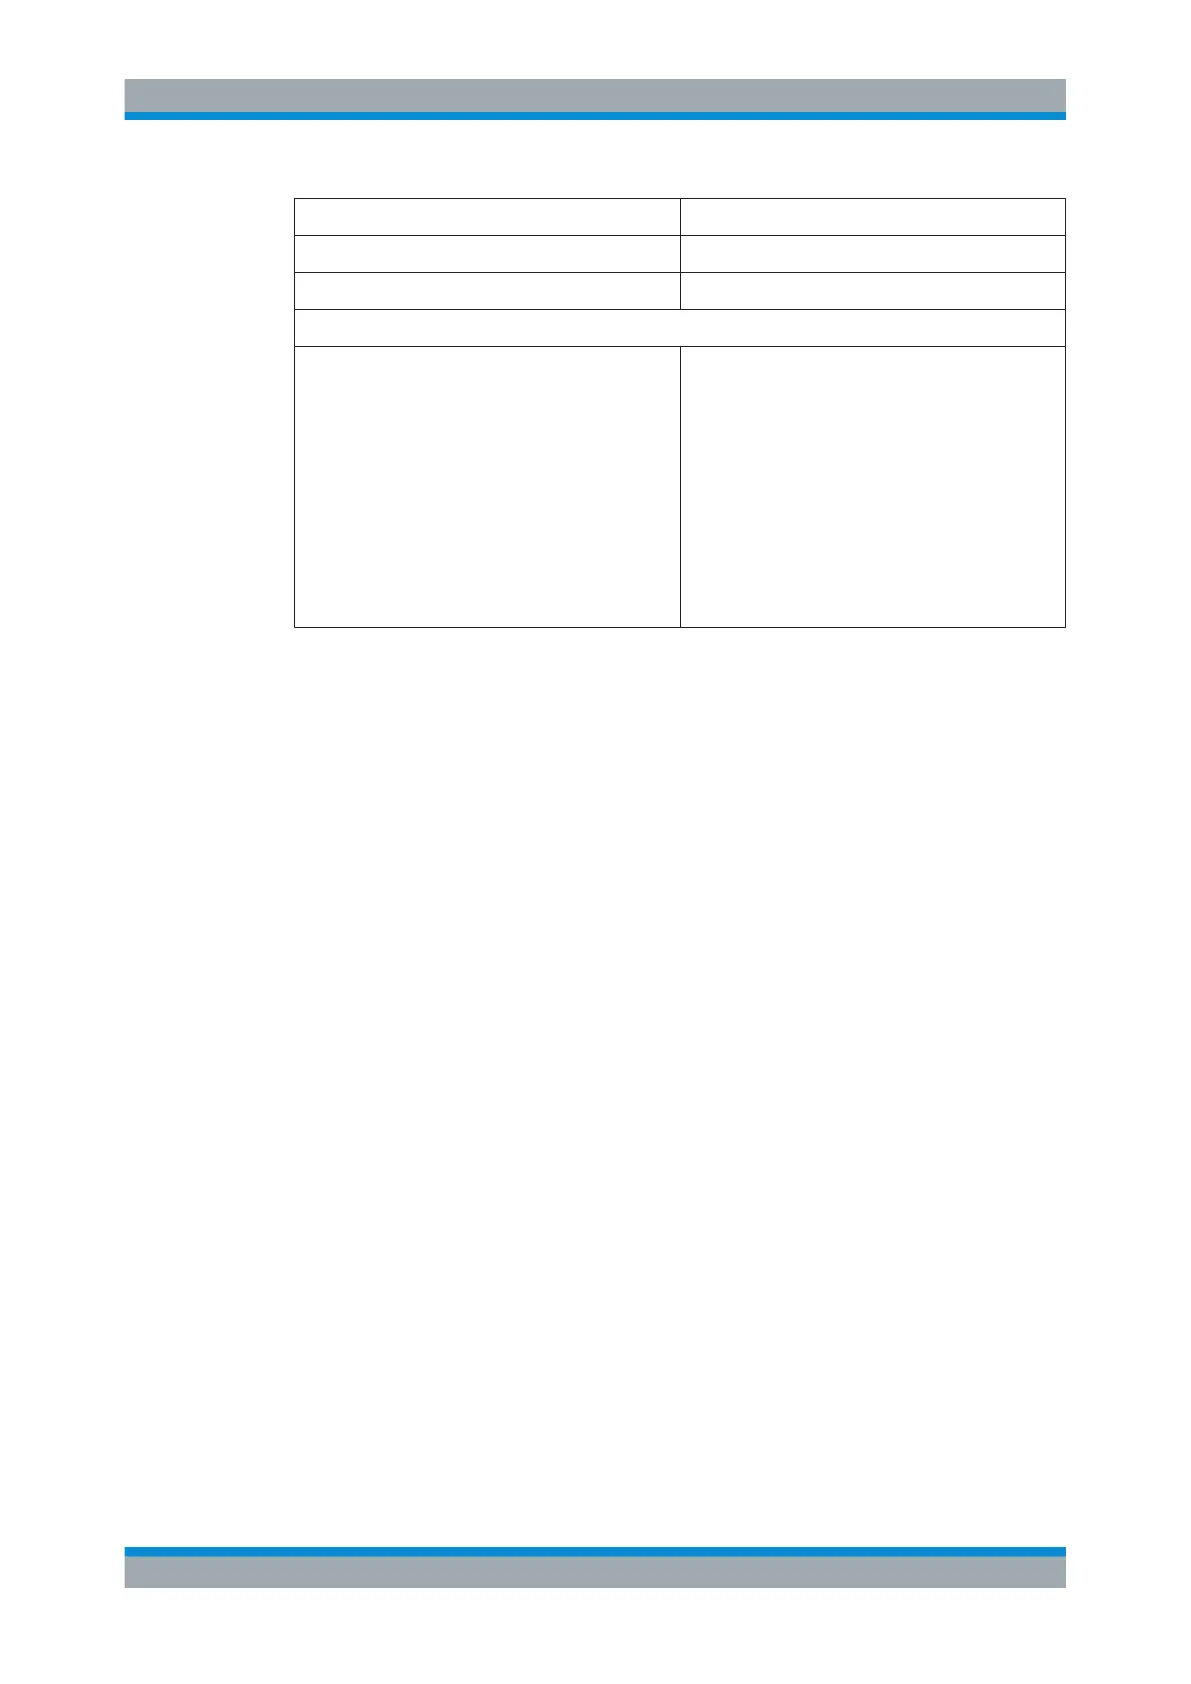
File contents Explanation
PeaksPerRange;25; Max. number of peaks per range to be detected
Values;3; Number of detected peaks
File data section
0;9000;150000;1000;79500;-25.006643295288086;-
12.006643295288086;PASS;
0;9000;150000;1000;101022.11126961483;-47.075
111389160156;-34.075111389160156;PASS;
0;9000;150000;1000;58380.171184022824;-47.079
341888427734;-34.079341888427734;PASS;
Measured peak values:
<range number>;
<start frequency>;
<stop frequency>;
<resolution bandwidth of range>;
<frequency of peak>;
<absolute power in dBm of peak>;
<distance to the limit line in dB>; (positive value
means above the limit)
<limit fail (pass = 0, fail =1)>;
7.8 Statistical Measurements (APD, CCDF)
To measure the amplitude distribution, the R&S FSV/A has simple measurement func-
tions to determine both the Amplitude Probability Distribution (APD) and the Comple-
mentary Cumulative Distribution Function (CCDF). Only one of the signal statistic func-
tions can be switched on at a time.
● About the Measurements......................................................................................264
● Typical Applications...............................................................................................265
● APD and CCDF Results........................................................................................265
● APD and CCDF Basics - Gated Triggering........................................................... 267
● APD and CCDF Configuration.............................................................................. 269
● How to Perform an APD or CCDF Measurement..................................................275
● Examples.............................................................................................................. 276
● Optimizing and Troubleshooting the Measurement.............................................. 279
7.8.1 About the Measurements
The probability of amplitude values can be measured with the Amplitude Probability
Distribution function (APD). During a selectable measurement time all occurring ampli-
tude values are assigned to an amplitude range. The number of amplitude values in
the individual ranges is counted and the result is displayed as a histogram.
Alternatively, the Complementary Cumulative Distribution Function (CCDF) can be dis-
played. It shows the probability that the mean signal power amplitude will be exceeded
in percent.
Only one of the signal statistic functions can be switched on at a time. When a statistic
function is switched on, the R&S FSV/A is set into zero span mode automatically. The
R&S FSV/A measures the statistics of the signal applied to the RF input with the
defined analysis bandwidth. To avoid affecting the peak amplitudes the video band-
Statistical Measurements (APD, CCDF)

 Loading...


