Measurements and Results
R&S
®
FSVA3000/ R&S
®
FSV3000
276User Manual 1178.8520.02 ─ 01
5. Start a sweep.
As soon as the defined number of samples have been measured, the statistical
evaluation is displayed. Only the signal levels within the pulse periods are consid-
ered.
7.8.7 Examples
7.8.7.1 Configuration Example: Gated Statistics
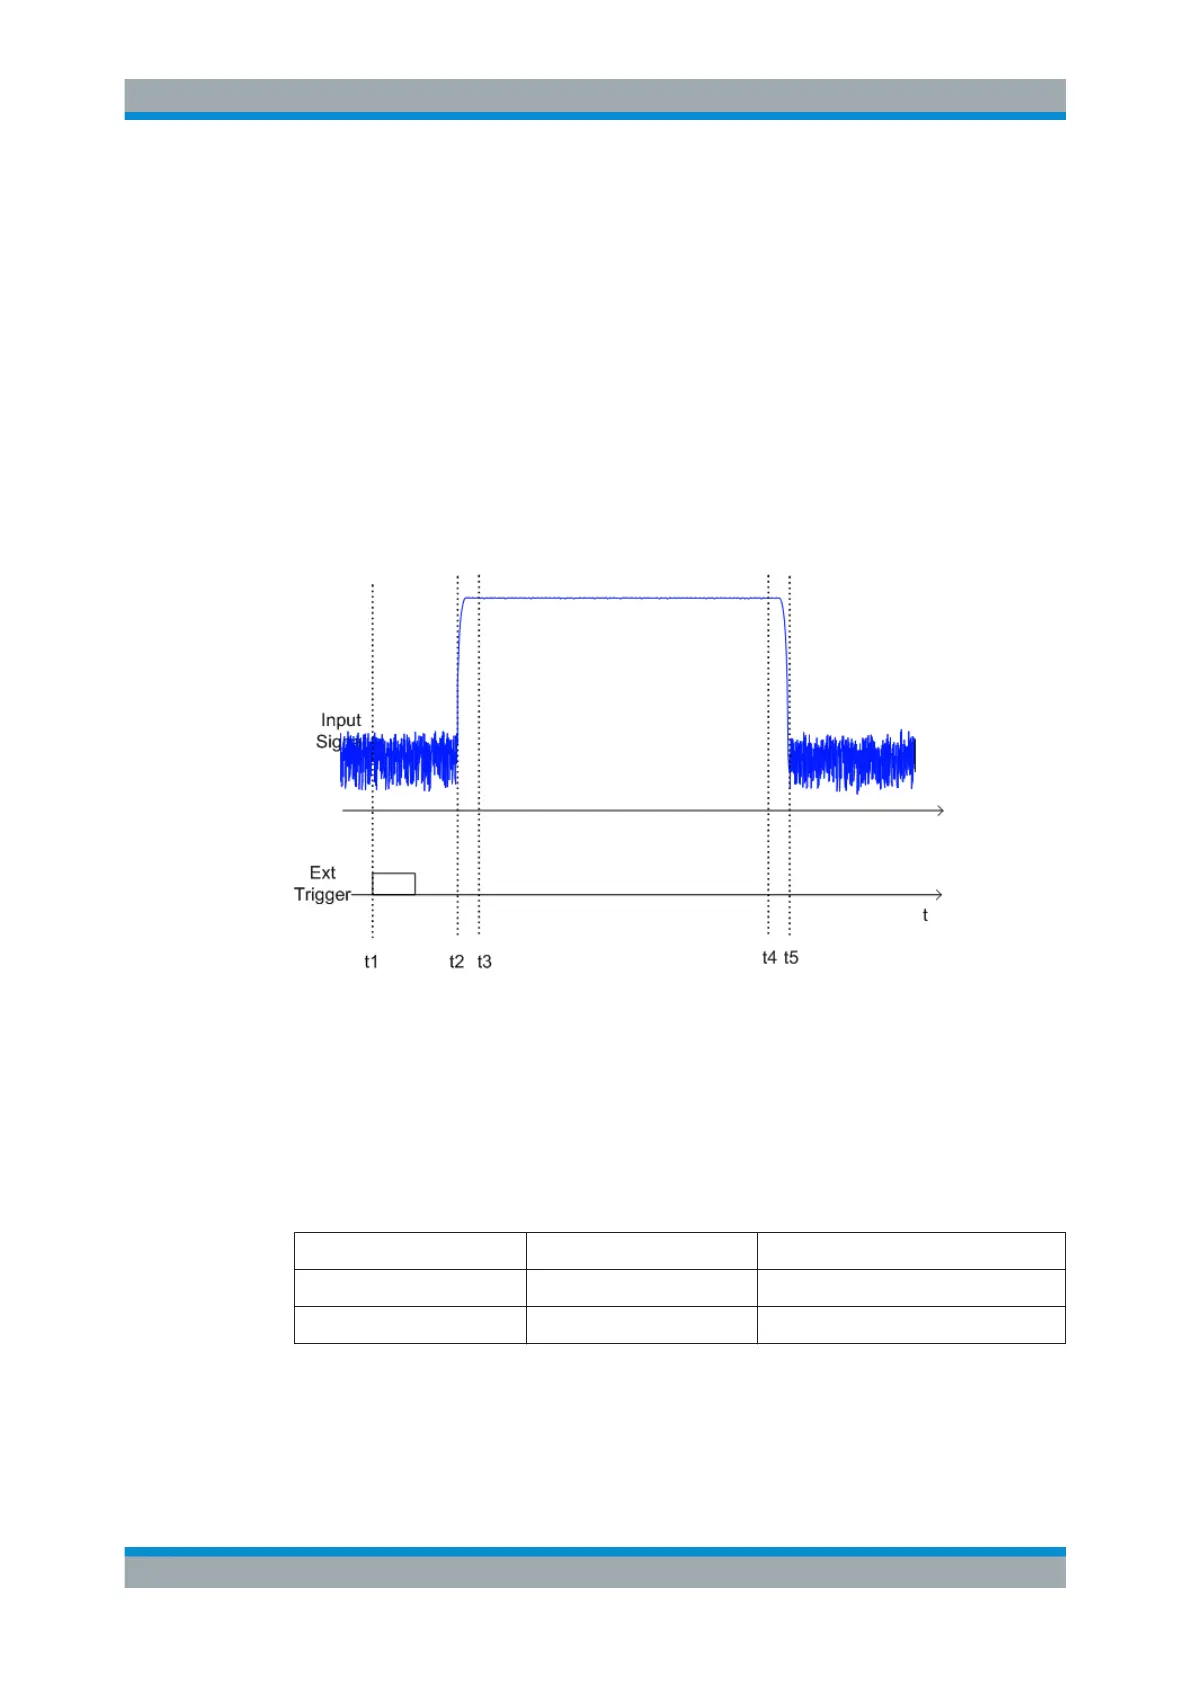
A statistics evaluation has to be done over the useful part of the signal between t3 and
t4. The period of the GSM signal is 4.61536 ms.
t1: External positive trigger slope
t2: Begin of burst (after 25 µs)
t3: Begin of useful part, to be used for statistics (after 40 µs)
t4: End of useful part, to be used for statistics (after 578 µs)
t5: End of burst (after 602 µs)
The instrument has to be configured as follows:
Trigger Offset t2 – t1 = 25 µs now the gate ranges are relative to t2
Range1 Start t3 – t2 = 15 µs start of range 1 relative to t2
Range1 End t4 – t2 = 553 µs end of range 1 relative to t2
Statistical Measurements (APD, CCDF)

 Loading...


