Common Analysis and Display Functions
R&S
®
FSVA3000/ R&S
®
FSV3000
516User Manual 1178.8520.02 ─ 01
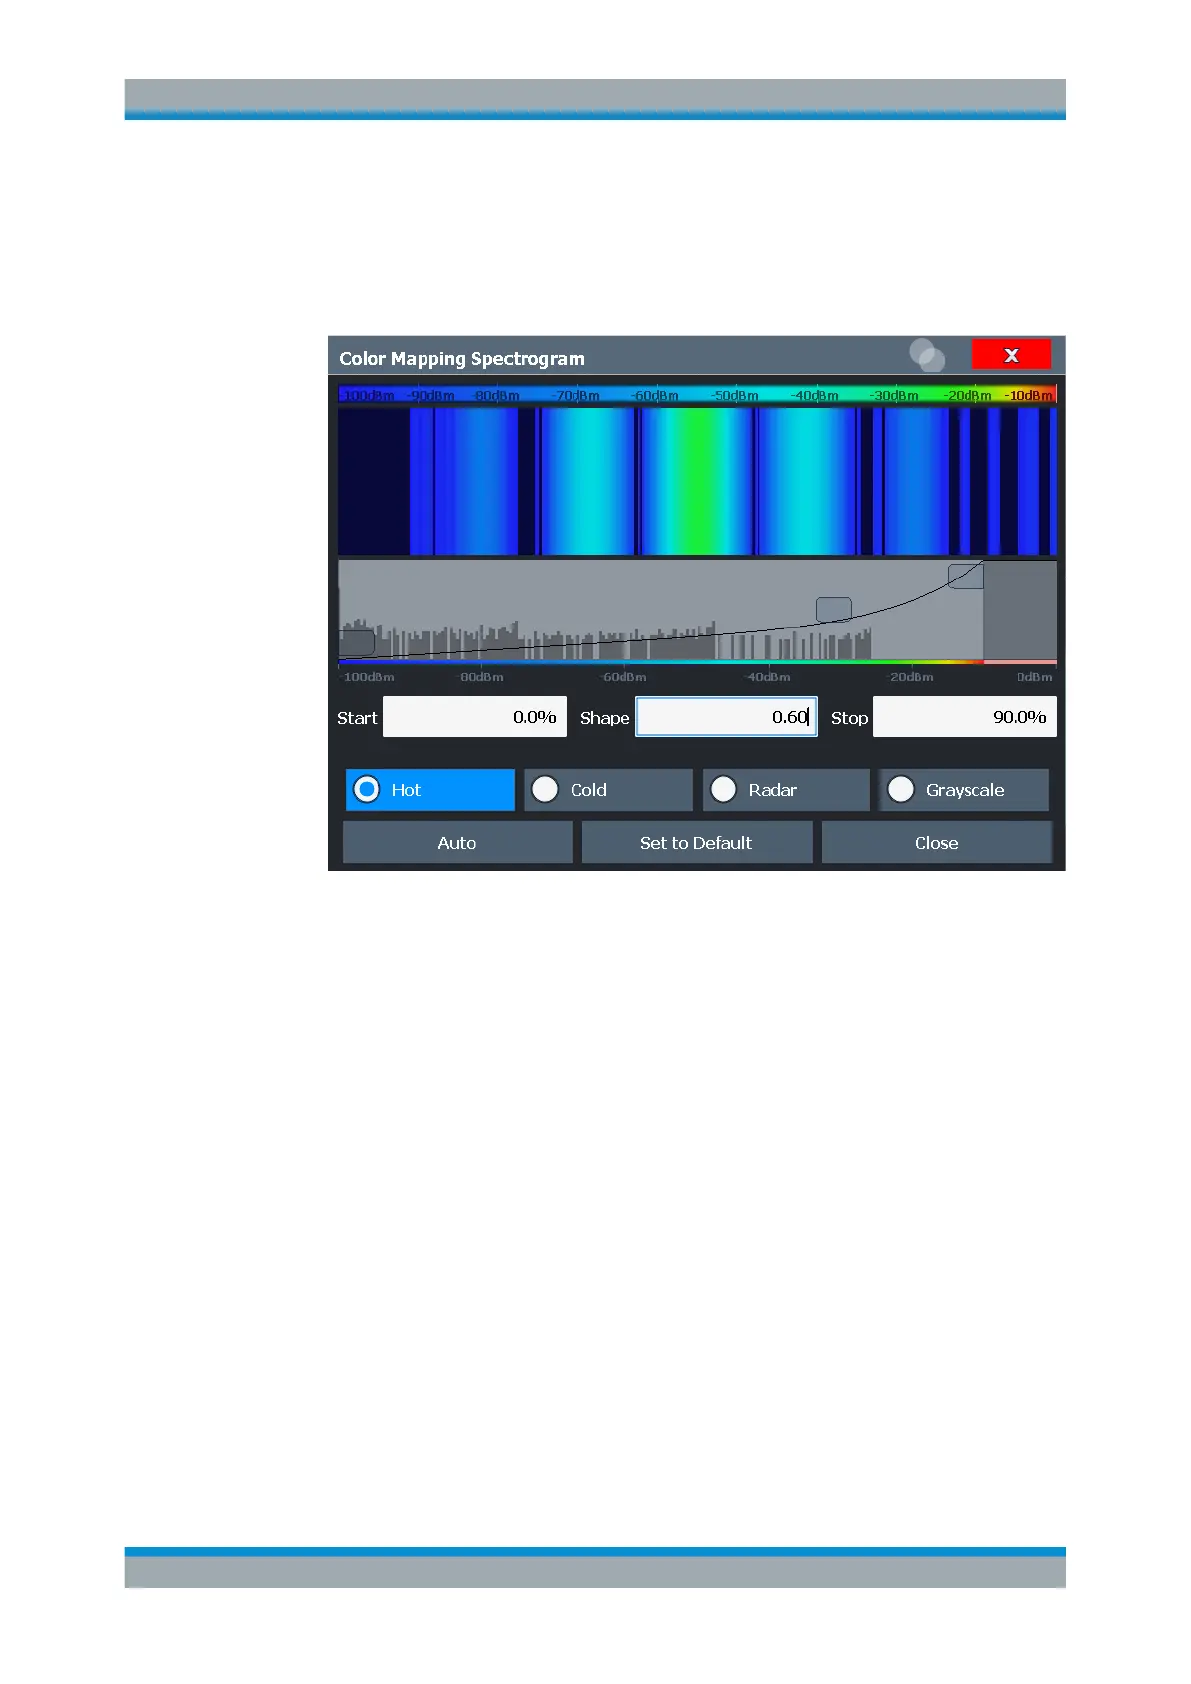
To set the color curve shape graphically using the slider
► Select and drag the color curve shape slider (indicated by a gray box in the middle
of the color curve) to the left or right. The area beneath the slider is focused, i.e.
more colors are distributed there.
To set the color curve shape numerically
► In the "Shape" field, enter a value to change the shape of the curve:
● A negative value (-1 to <0) focuses the lower values
● 0 defines a linear distribution
● A positive value (>0 to 1) focuses the higher values
9.5.3 Trace Math
Access: [TRACE] > "Trace Math"
If you have several traces with different modes, for example an average trace and a
maximum trace, it may be of interest to compare the results of both traces. In this
example, you could analyze the maximum difference between the average and maxi-
mum values. To analyze the span of result values, you could subtract the minimum
trace from the maximum trace. For such tasks, the results from several traces can be
combined using mathematical functions.
Trace Configuration

 Loading...


