Getting Started
R&S
®
FSVA3000/ R&S
®
FSV3000
59User Manual 1178.8520.02 ─ 01
c) In the "Center" field, enter 64 on the number pad on the front panel.
d) Press the "MHz" key next to the number pad.
2. Reduce the span to 20 MHz:
a) In the "Span" field of the "Frequency" dialog box, enter 20
MHz.
b) Close the "Frequency" dialog box.
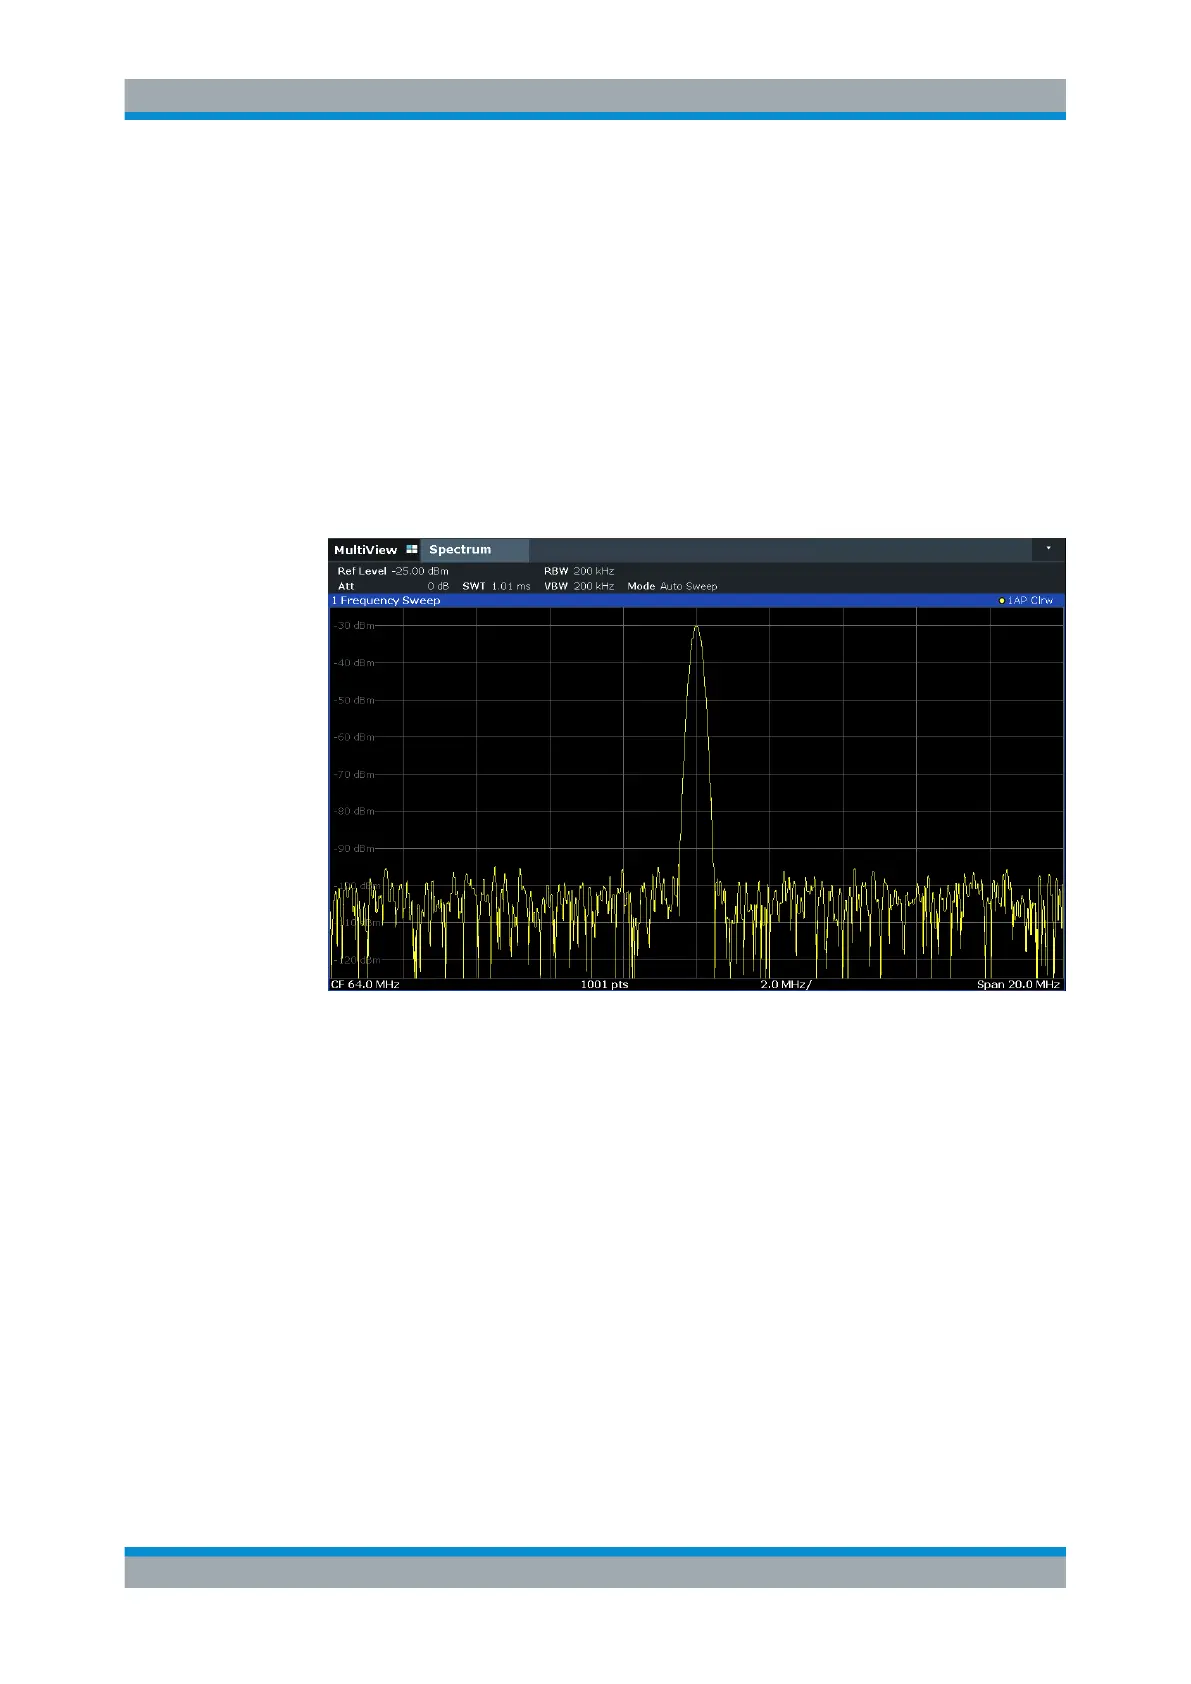
3. Set the reference level to -25 dBm:
a) In the configuration "Overview", tap the "Amplitude" button.
b) In the "Value" field of the "Amplitude" dialog box, enter -25
dBm.
The display of the calibration signal is now improved. The maximum at the center
frequency (=calibration frequency) of 64 MHz becomes visible.
Figure 5-5: Calibration signal with optimized display settings
5.3.2 Displaying a Spectrogram
In addition to the standard "level versus frequency" spectrum display, the R&S FSV/A
also provides a spectrogram display of the measured data. A spectrogram shows how
the spectral density of a signal varies over time. The x-axis shows the frequency, the y-
axis shows the time. A third dimension, the power level, is indicated by different colors.
Thus you can see how the strength of the signal varies over time for different frequen-
cies.
1. Tap the "Overview" softkey to display the general configuration dialog box.
2. Tap the "Display Config" button.
The SmartGrid mode is activated, and the evaluation bar with the available evalua-
tion methods is displayed.
Trying Out the Instrument

 Loading...


