Measurements and Results
R&S
®
FSVA3000/ R&S
®
FSV3000
131User Manual 1178.8520.02 ─ 01
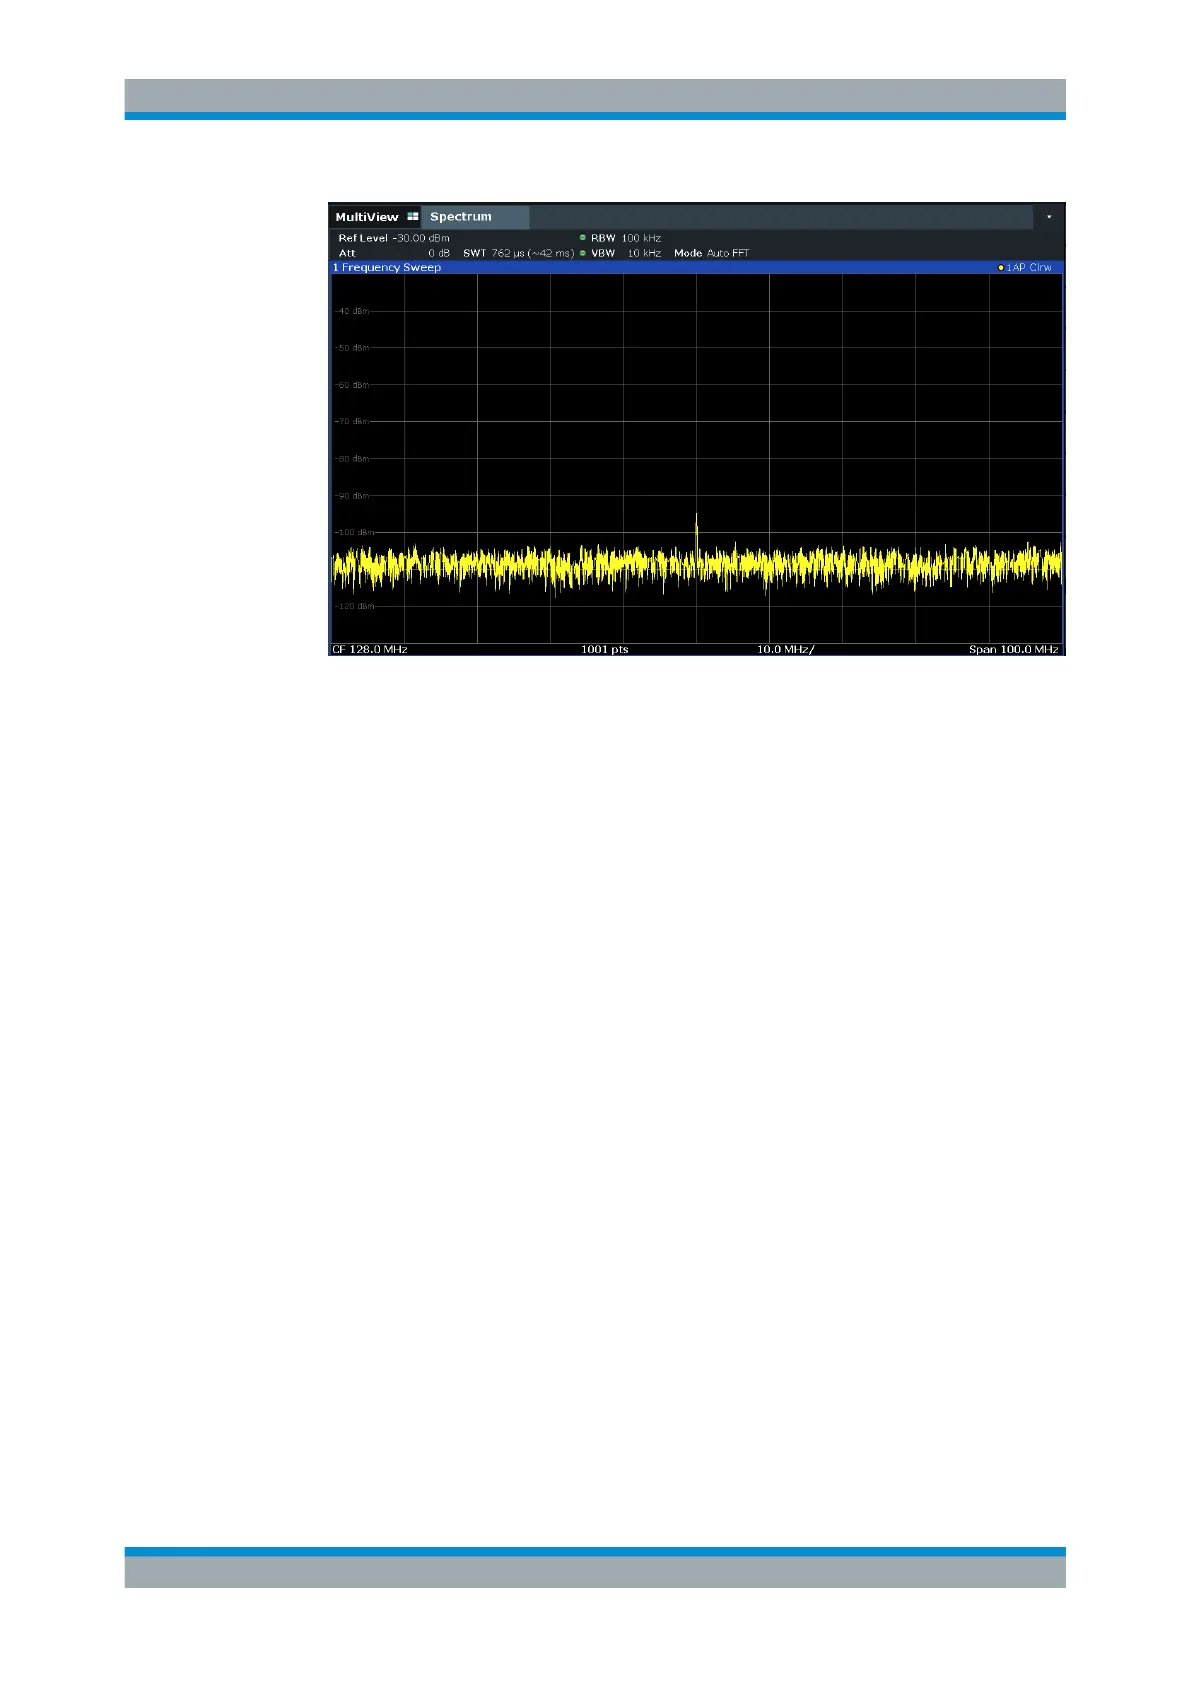
Figure 7-4: Reference signal at a smaller resolution bandwidth
7.2.5 Measurement Examples - Measuring Signal Spectra with Multiple
Signals
● Separating Signals by Selecting the Resolution Bandwidth................................. 131
● Measuring the Modulation Depth of an AM-Modulated Carrier in the Frequency
Domain..................................................................................................................135
● Measuring AM-Modulated Signals........................................................................ 136
7.2.5.1 Separating Signals by Selecting the Resolution Bandwidth
A basic feature of a Signal and Spectrum Analyzer is the ability to separate the spec-
tral components of a mixture of signals. The resolution at which the individual compo-
nents can be separated is determined by the resolution bandwidth. Selecting a resolu-
tion bandwidth that is too large may make it impossible to distinguish between spectral
components, i.e. they are displayed as a single component (see also Chapter 8.5.1.1,
"Separating Signals by Selecting an Appropriate Resolution Bandwidth",
on page 377).
Two signals with the same amplitude can be resolved if the resolution bandwidth is
smaller than or equal to the frequency spacing of the signal. If the resolution bandwidth
is equal to the frequency spacing, the spectrum display shows a level drop of 3 dB pre-
cisely in the center of the two signals. Decreasing the resolution bandwidth makes the
level drop larger, which thus makes the individual signals clearer.
In this measurement example we will analyze two signals with a level of -30 dBm each
and a frequency spacing of 30 kHz.
Basic Measurements

 Loading...


