Common Analysis and Display Functions
R&S
®
FSVA3000/ R&S
®
FSV3000
467User Manual 1178.8520.02 ─ 01
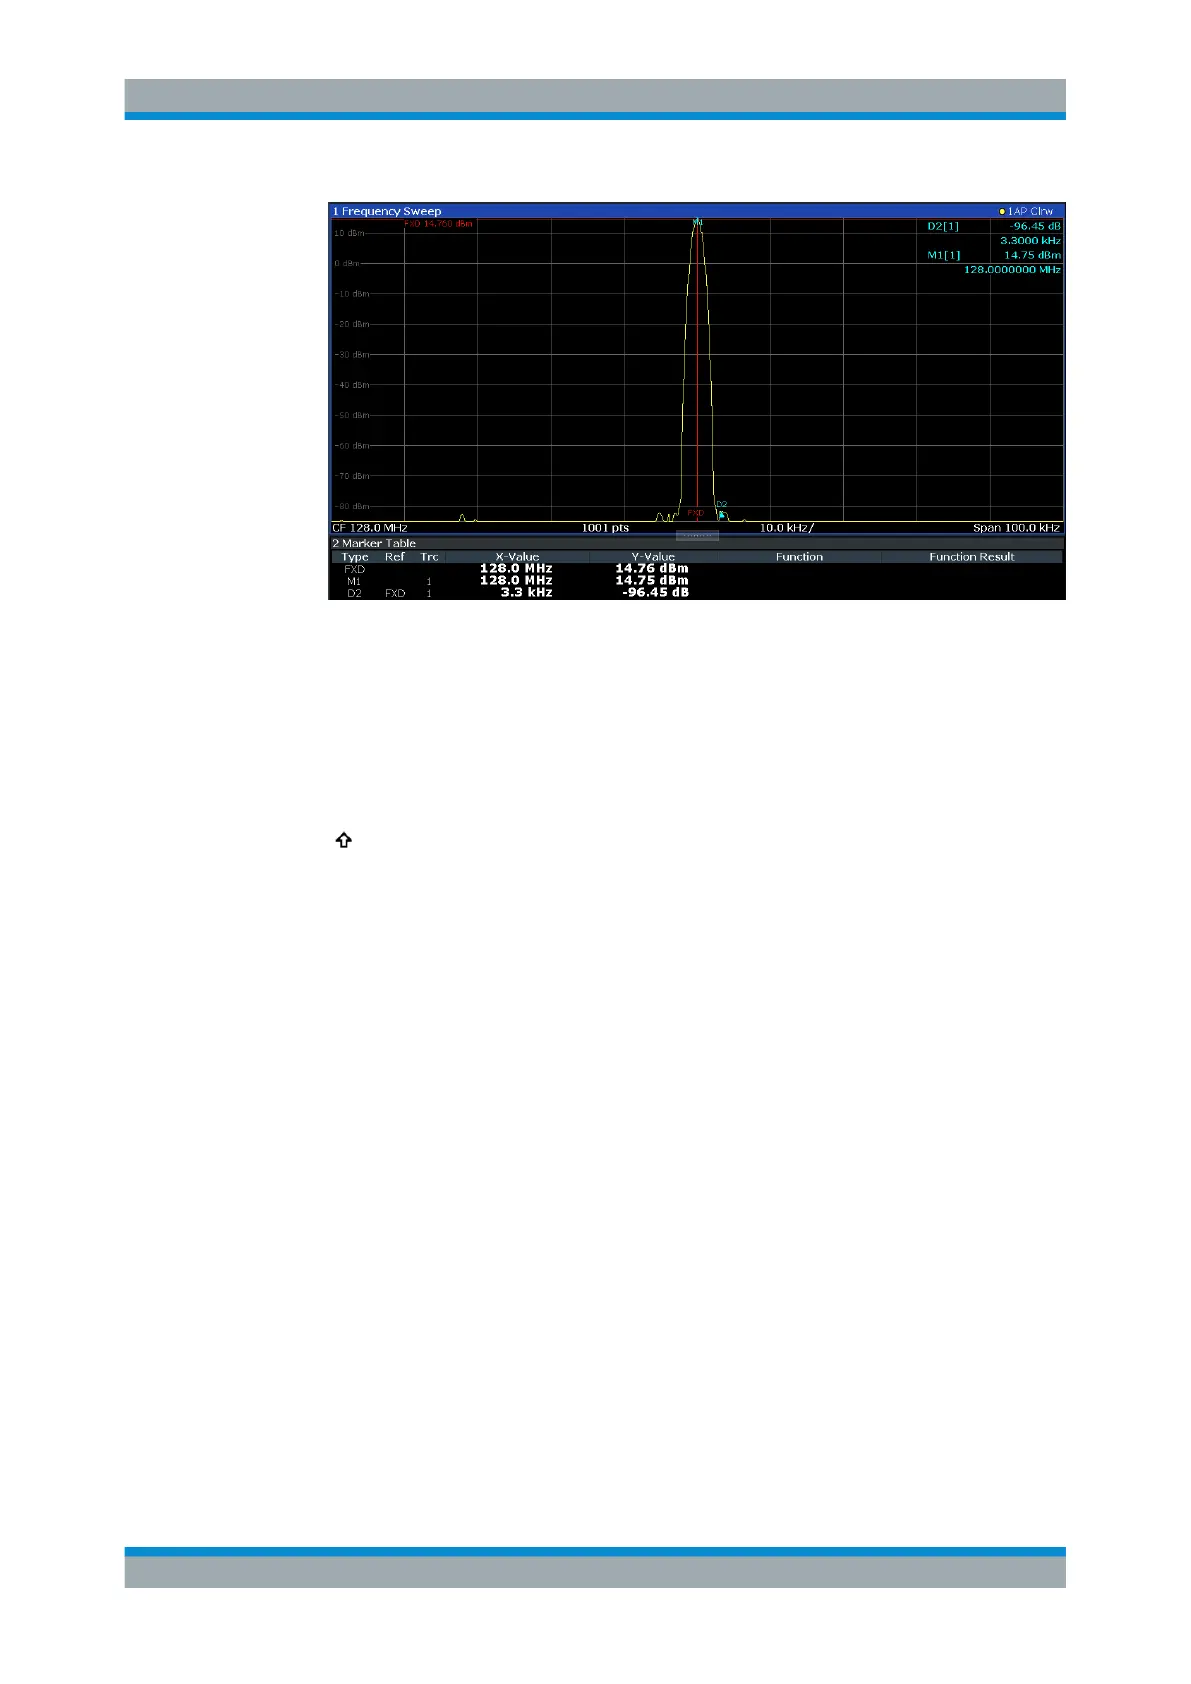
Figure 9-7: Fundamental wave and the frequency and level reference point
7. Make the step size for the center frequency correspond to the signal frequency: in
the "Frequency" configuration dialog box, select "Center Frequency Stepsize" =
"Marker" .
The step size for the center frequency is now equal to the marker frequency.
8.
Move the center frequency to the 2
nd
harmonic of the signal by pressing the [UP]
(
) key.
The center frequency is set to the 2
nd
harmonic.
9. Select "Auto Level" to ensure the R&S FSV/A measures the harmonics with a high
sensitivity.
10.
Place the delta marker on the 2
nd
harmonic: in the "Marker To" menu, select the
"Peak" softkey.
The delta marker moves to the maximum of the 2
nd
harmonic. The displayed level
result is relative to the reference point level (= fundamental wave level).
The other harmonics are measured by repeating steps step 8 to step 10, with the cen-
ter frequency being incremented or decremented in steps of 128 MHz using the [UP] or
[DOWN] keys.
9.4 Display and Limit Lines
Display and limit lines help you analyze a measurement trace.
Display and Limit Lines

 Loading...


