Getting Started
R&S
®
FSVA3000/ R&S
®
FSV3000
60User Manual 1178.8520.02 ─ 01
3.
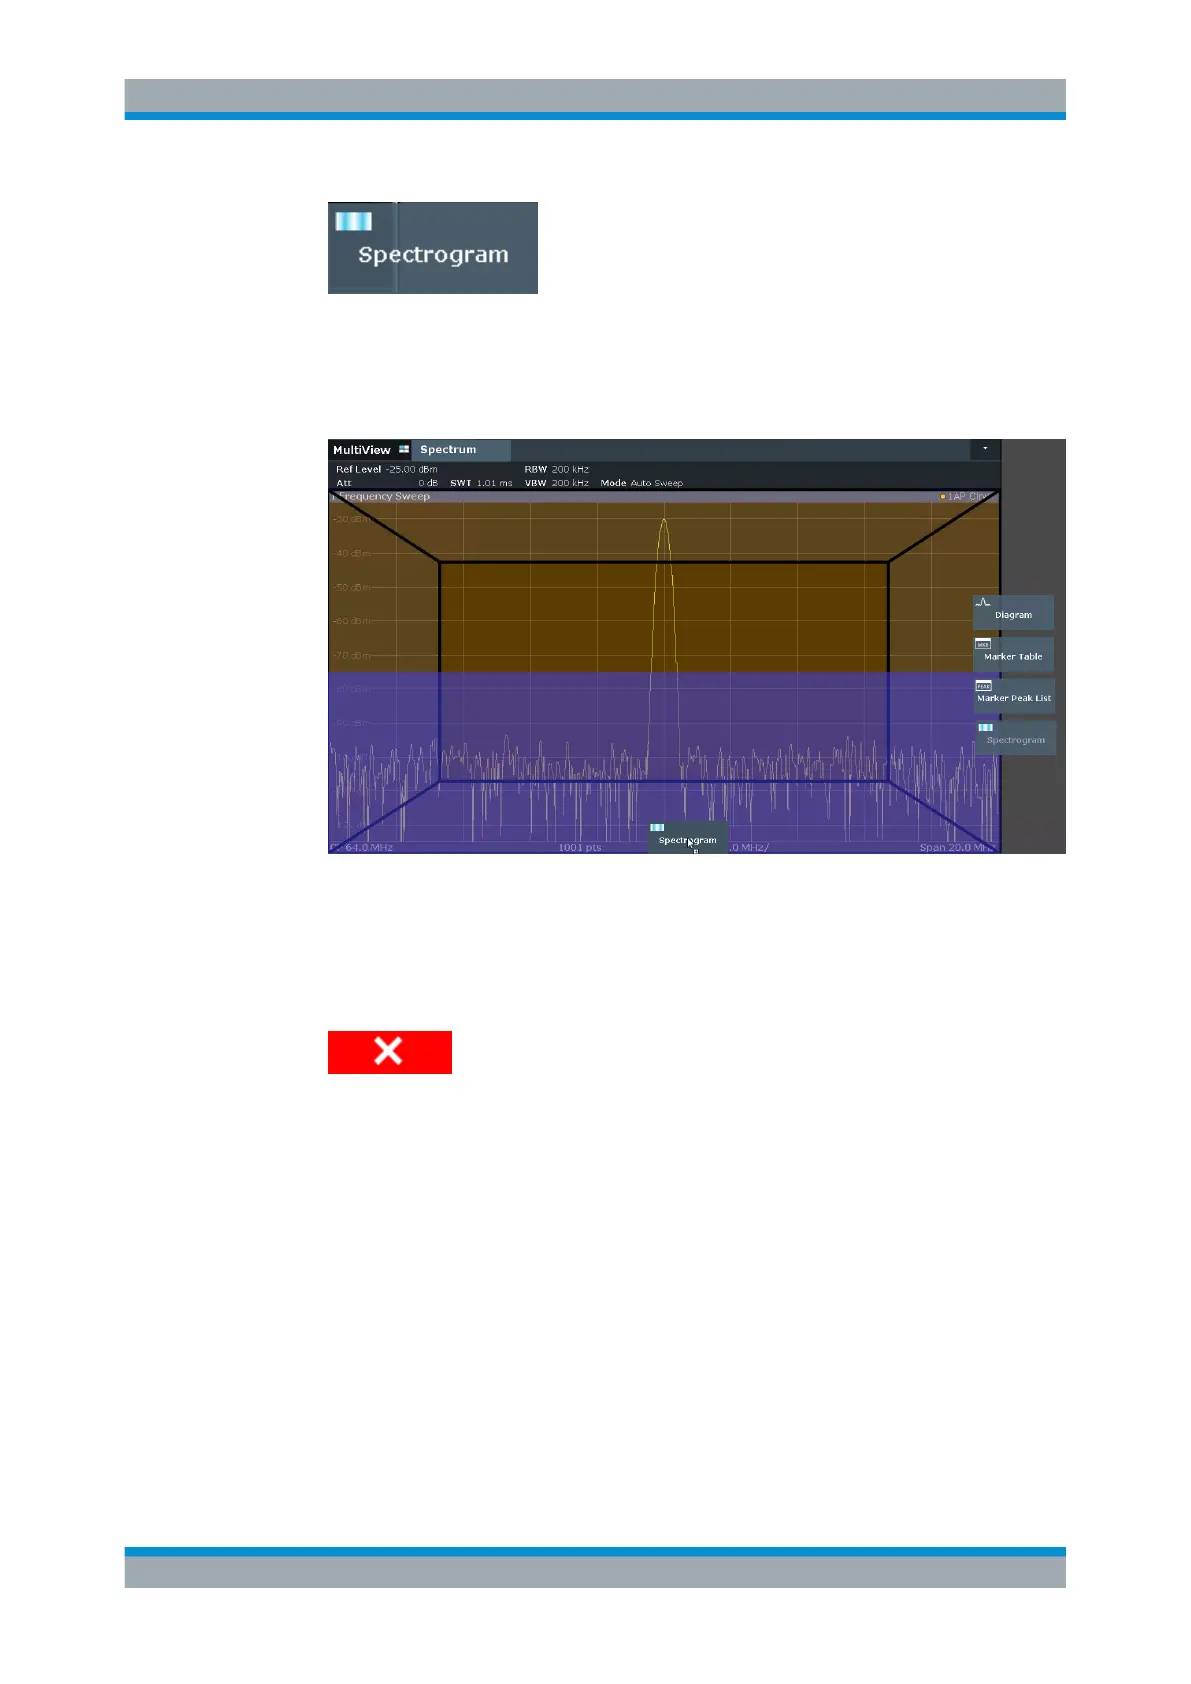
Drag the "Spectrogram" icon from the evaluation bar to the diagram area. The blue
area indicates that the new diagram would replace the previous spectrum display.
Since we do not want to replace the spectrum, drag the icon to the lower half of the
display to add an additional window instead.
Figure 5-6: Adding a Spectrogram to the display
Drop the icon.
4. Close the SmartGrid mode by tapping the "Close" icon at the top right corner of the
toolbar.
You see the spectrogram compared to the standard spectrum display. Since the
calibration signal does not change over time, the color of the frequency levels does
not change over time, i.e. vertically. The legend at the top of the spectrogram win-
dow describes the power levels the colors represent.
Trying Out the Instrument

 Loading...


