6.1 Printed Report Examples
HA-8190V 6-5
6.1.2 Accuracy Control Reports
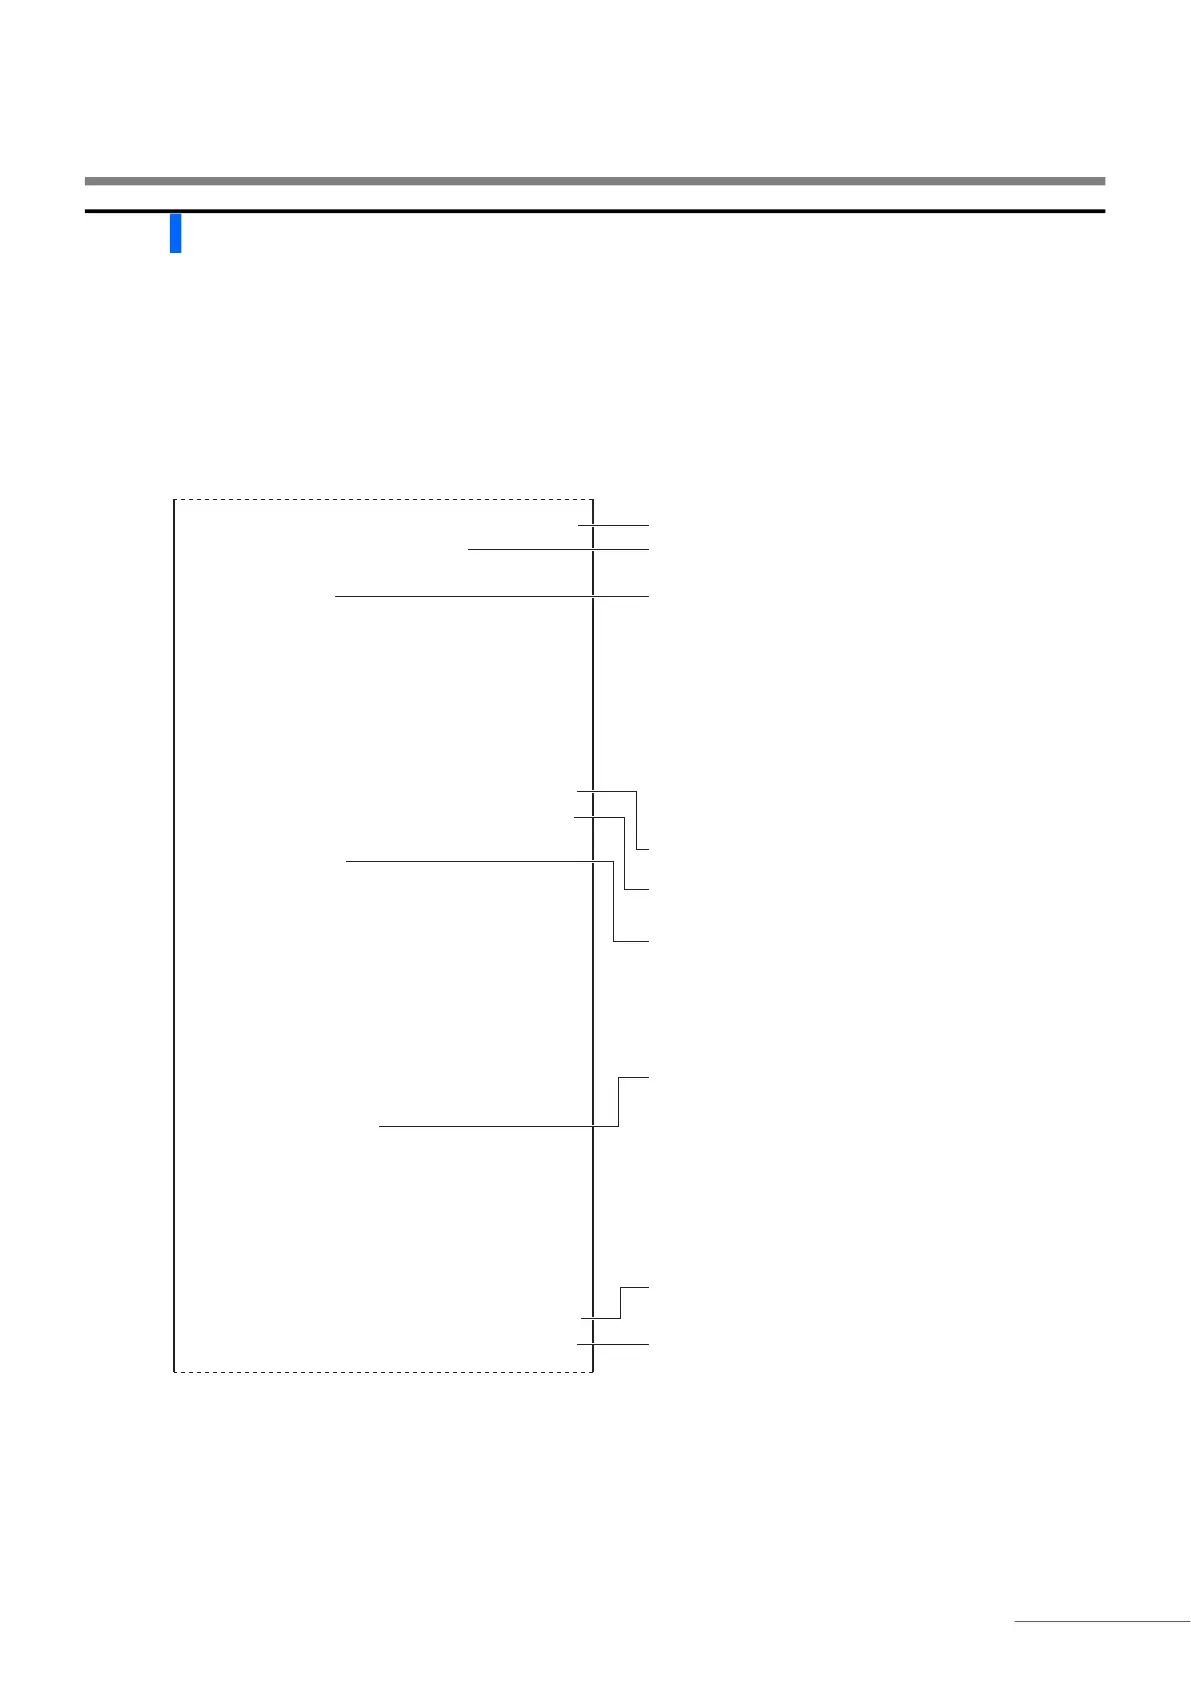
Accuracy control reports show statistical information on HbA1c control measurements and sample measurements for
a specified period of time.
Example
*1: If the control measurement was performed two or more times in one day, the number of times that the Low
solution was measured after the following operations appears on the next line:
• Changing expected values
• Calibration
*2: These are the control expected values that were set as <Ctrl expected value mmol/mol> on the [Meas. condition
setup] screen when the control measurements were performed. However, if different expected values were later
set on the [View] screen for individual measurement results, the newly set values appear here instead.
REFERENCE:
Printing instructions: See “3.9.3. Printing Accuracy Control Reports” on page 3-35.
Accuracy control
Var.
10-06-2017 10:00
––––––––––––––––––––––––
HbA1c control LOW
Date N Expected Mean Diff.
05-01 3 33 33.4 0.4
05-02*3 33 33.8 0.8
:
:
05-15C3 33 33.1 0.1
Mean
0.4
R
0.7
––––––––––––––––––––––––
HbA1c control HIGH
Date N Expected Mean Diff.
05-01 3 92 92.6 0.6
05-02*3 92 92.0 0.0
:
:
05-15C3 92 92.6 0.6
Mean
0.4
R
1.0
––––––––––––––––––––––––
Measurement information
Date N R. time Pressure
05-01 45 18.5 37.2
05-02* 66 18.4 37.5
:
:
05-15C 53 18.5 37.7
Total meas. count
508
Column change count
0
Print date
Selected measurement mode
Mean calculated within the specified range of dates
Difference between the maximum and minimum within
the specified range of dates
Control measurement (High solution) statistical information
Total number of measurements within the specified range of
dates
Number of times that the column was replaced within
the specified range of dates
Statistical information on normal/STAT/control measurements
and calibration
Date: Measurement date
N: Total number of normal/STAT/control
measurements and calibrations in one day
R. time: S-A1c peak retention time (seconds)
Pressure: Mean value of column pressure
*: Date when the column was replaced
C: Date when HbA1c calibration was performed
Control measurement (Low solution) statistical information
Date: Measurement date
N: Number of times that the control (Low solution)
was measured in one day *1
Expected: Control expected values *2
Mean: Mean measurement result for “the number of
sample containers × the number of measurements
per sample container”
Diff.: Difference between [Expected] and [Mean]
*: Date when the column was replaced
C: Date when HbA1c calibration was performed

 Loading...