7. Advanced
Applying a correction in a certain zone also influences the adjacent zones.
The hierarchical levels are selected in a way that the first hierarchy level influences the entire transition from black to white (0% to
100%) with the main correction done at 25%. Below you can find the table of the hierarchy levels and their influence zone.
Hierarchy level (value 1–4) Hierarchy level (%) Gray level range
1
25.0% 0.0% - 100.0%
6.3% 0.0% - 25.0%
2
56.3% 25.0% - 100.0%
1.6% 0.0% - 6.3%
14.1% 3.6% - 25.0%
39.1% 25.0% - 56.3%
3
76.6% 56.3% -100.0%
0.4% 0.0% - 1.6%
3.5% 1.6% - 6.3%
9.8% 6.3% - 14.1%
19.1% 14.1% - 25.0%
31.6% 25.0% - 39.1%
47.3% 39.1% - 56.3%
66.0% 56.3% - 76.6%
4
87.9% 76.6% - 100.0%
The % values in the table indicate measurable brightness on the screen.
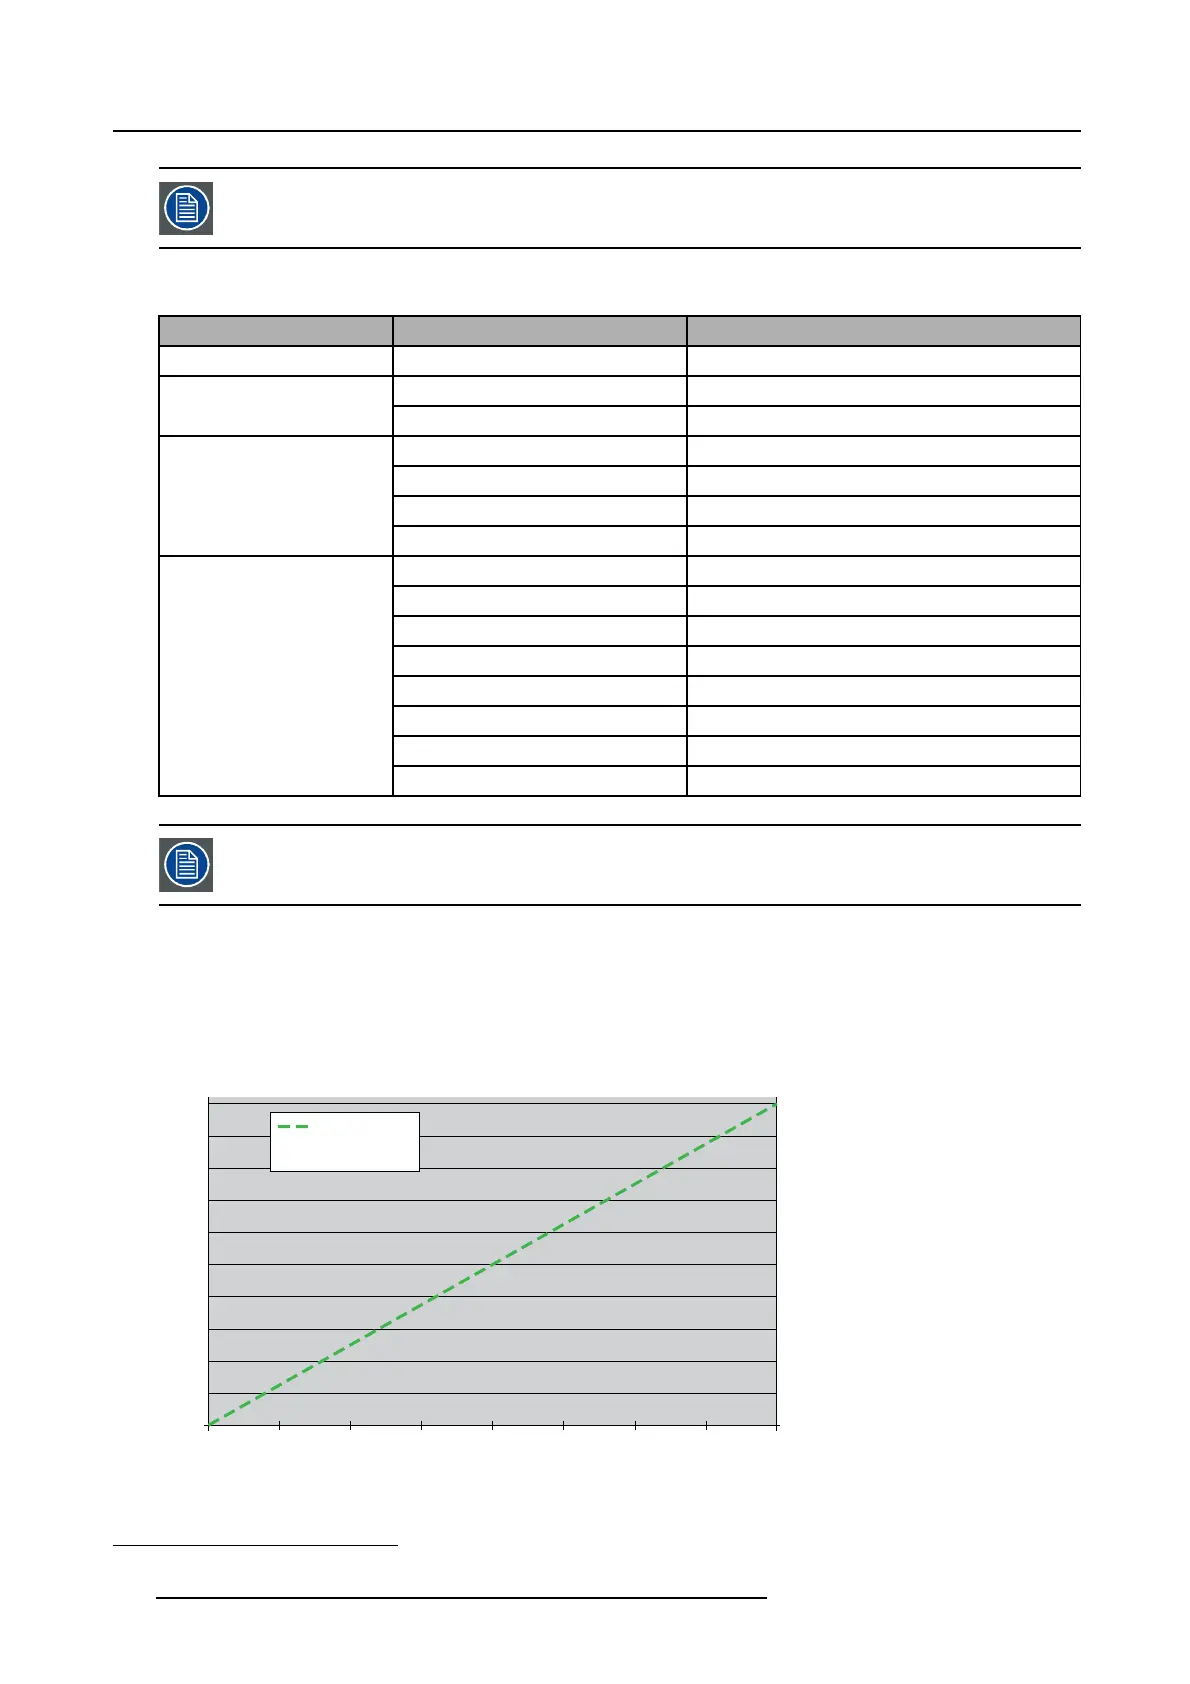
7.8.11.2 Illustrating the influence of GLD correction
Illustrating GLD correction
Without performing GLD correction, we have a linear response
1
from black to white. This is shown as a green dashed line in the
graph below, where we the horizontal axis represents the signal strength (0% to 100%) and the vertical axis the intensity.
Linear response
Intensity
Signal
0
512
1024
0
25% 50% 75% 100%
Image 7-141
GLD: response curve
The following topics give you an overview of the outcome of the GLD corrections done at different levels.
1. To be fully correct, we will have the gamma response curve instead of a linear response curve. In this explanation, we consider it to be linear however.
132 R59770198 BARCO SIM 7D 13/02/2013