SMP Gateway User Manual • 139
Still under Analog Points Columns, you can move the column names up and down using the
Move Up and Move Down buttons. Selected columns will appear from left to right, starting
with the first column name in the list.
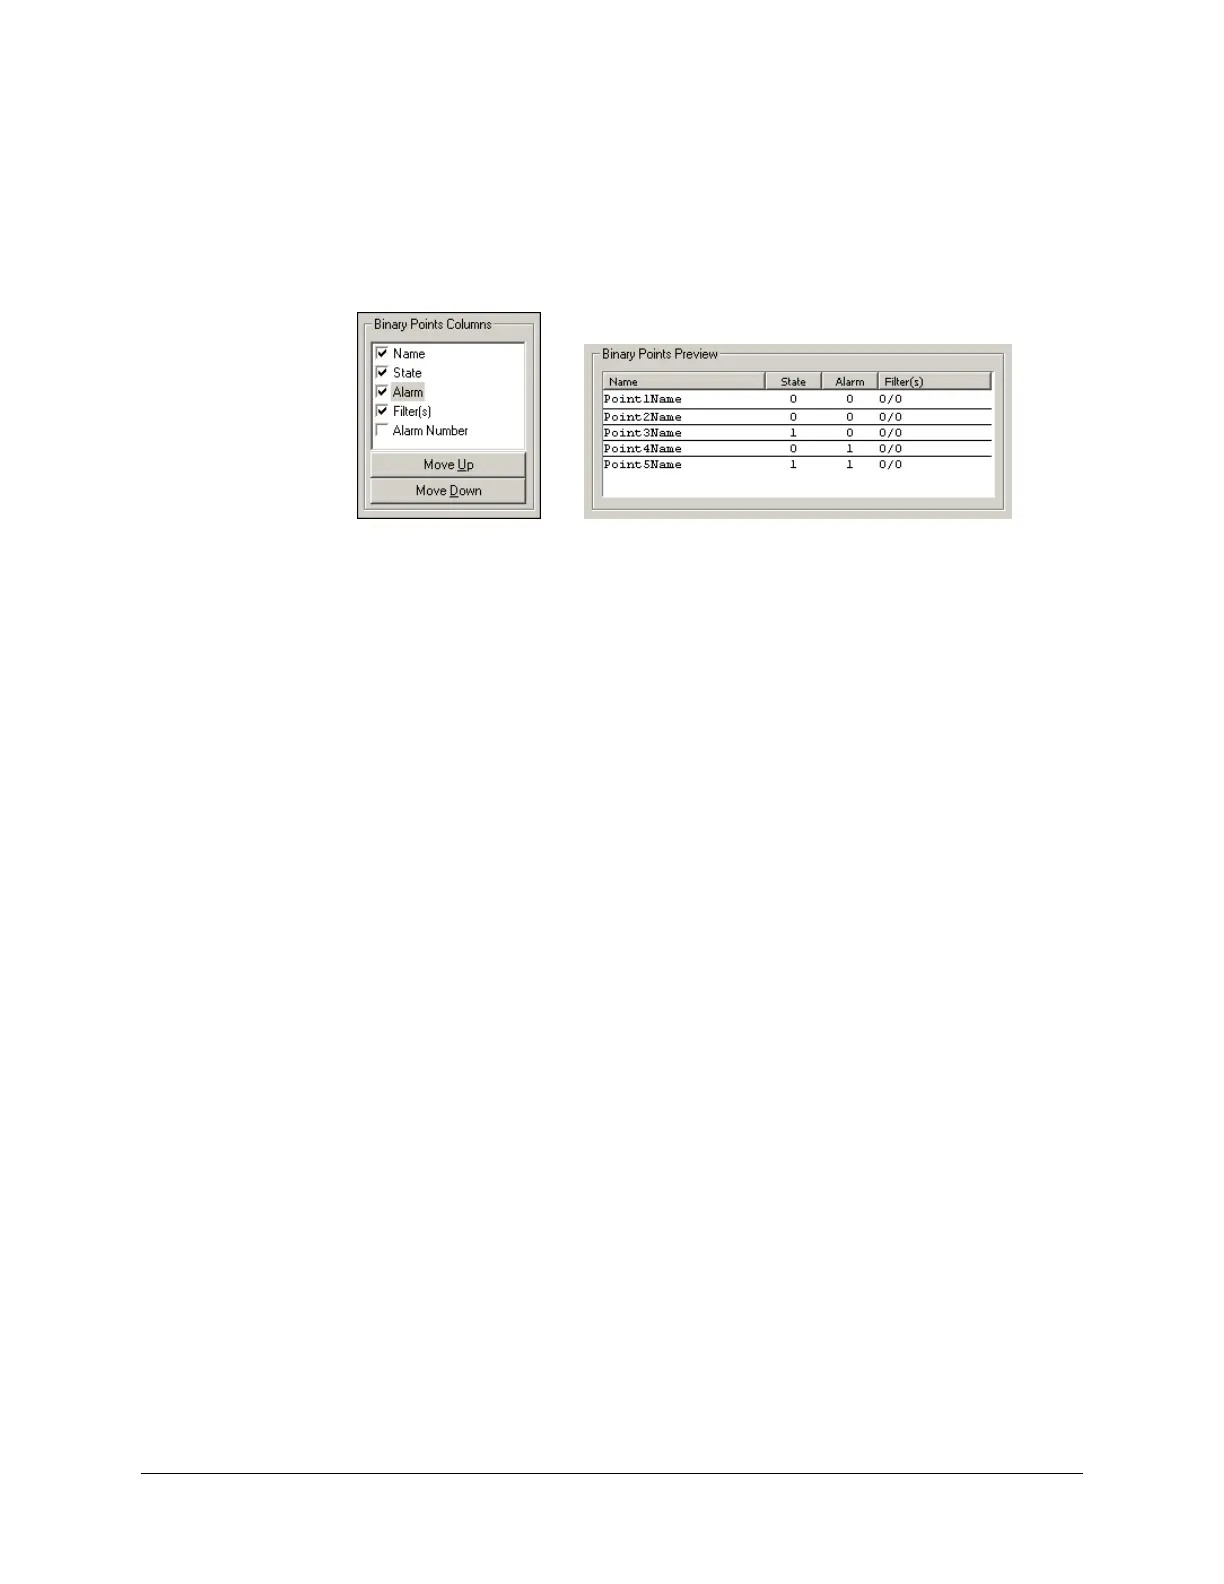
Under Binary Points Columns, select which columns should be displayed in binary
inputs/outputs lists. You can see the result of your selection under Binary Points Preview.
Still under Binary Points Columns, you can move the column names up and down using the
Move Up and Move Down buttons. Selected columns will appear from left to right, starting
with the first column name in the list.
You can also use both preview sections of the edition pane to modify the columns’ width,
order and availability state, like for the Alarms page (see “Setting Up the Alarms Page”,
above
).
Under Statistics, select the statistics pages you want to display, by marking the corresponding
checkboxes. Clear the checkboxes for the categories you want to hide. If you do not want to
display any statistics, clear the Show Statistics checkbox. The following statistics pages are
available in the Annunciator:
Vital System Information.
Contains the same information that is displayed in the page of the same name in
SMP Stats. Information available includes hardware/software information, temperature
information and power statuses.
Performance (General).
Contains real-time information about the SMP Gateway’s CPU load and memory usage.
Performance (Threads).
Contains real-time information about the SMP Gateway’s CPU load specific to each
execution thread.
Real Time Data Exchange.
Contains statistics about real-time data that is exchanged between the masters, the slaves
and other software components of the SMP Gateway.
SysServer.
Contains various real-time statistics that are maintained by the SMP Gateway’s system
server.
Master/slaves Scan Process.
Contains the scan process statistics of every master and slave.