C
HAPTER
5
| Monitoring the Switch
Displaying Information About Ports
– 203 –
WEB INTERFACE
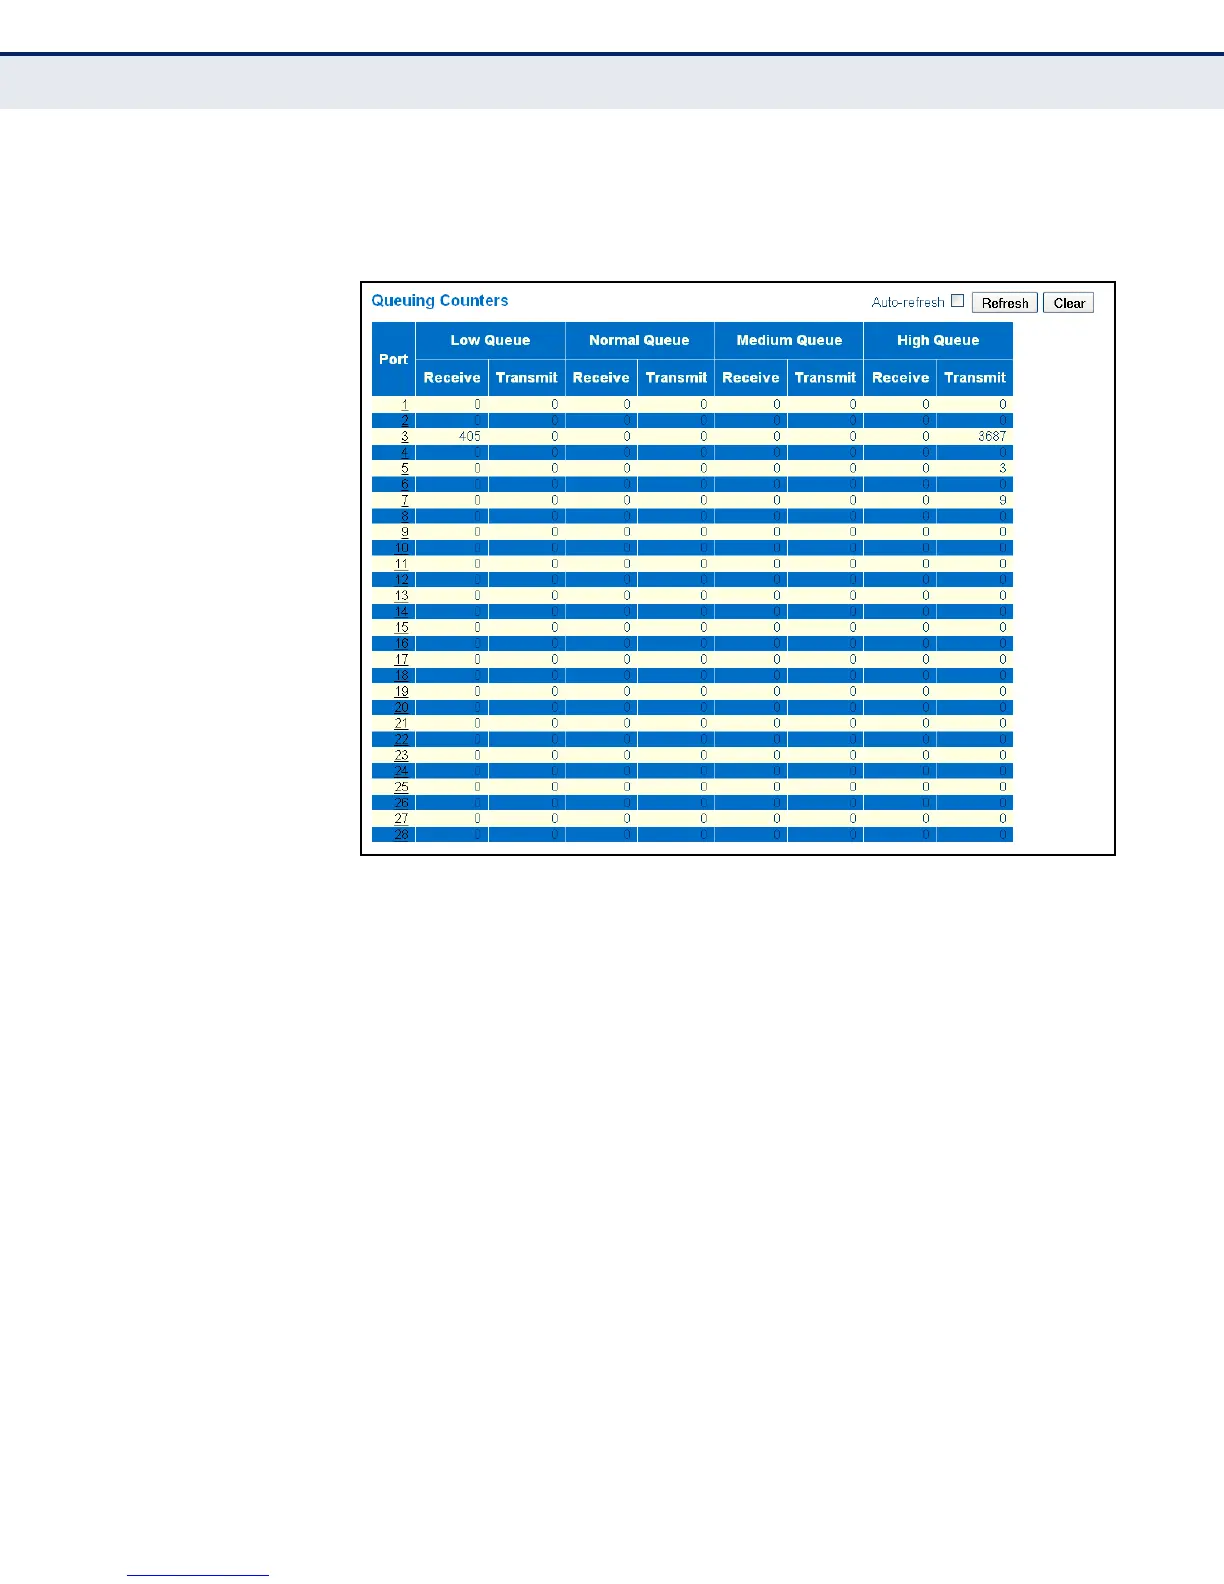
To display the queue counters, click Monitor, Ports, QoS Statistics.
Figure 75: Queuing Counters
DISPLAYING DETAILED
PORT STATISTICS
Use the Detailed Port Statistics page to display detailed statistics on
network traffic. This information can be used to identify potential problems
with the switch (such as a faulty port or unusually heavy loading).
All values displayed have been accumulated since the last system reboot,
and are shown as counts per second. Statistics are refreshed every 60
seconds by default.
CLI REFERENCES
◆ "port statistics" on page 289
PARAMETERS
These parameters are displayed in the web interface:
◆ Receive/Transmit Total
■
Packets – The number of received and transmitted packets (good
and bad).
■
Octets – The number of received and transmitted bytes (good and
bad), including Frame Check Sequence, but excluding framing bits.


 To Next Page