F - 2
F.8 P and T waves
P wave is searched in the interval preceding the QRS complex. A P wave may not be found in certain
arrhythmias. P onset and termination are determined basing on the amplitude and slope. The globe P onset and
termination is used over all 12 leads because in many leads the p wave amplitude may be too low. The baseline
for P wave amplitude measurement respect to P onset.
T termination is determined also depend on the amplitude and slope. The global T termination is derived
similarly to the globe QRS termination. The other components of the ECG waveform (ST and T) amplitudes are
also measured with respect to QRS onset.
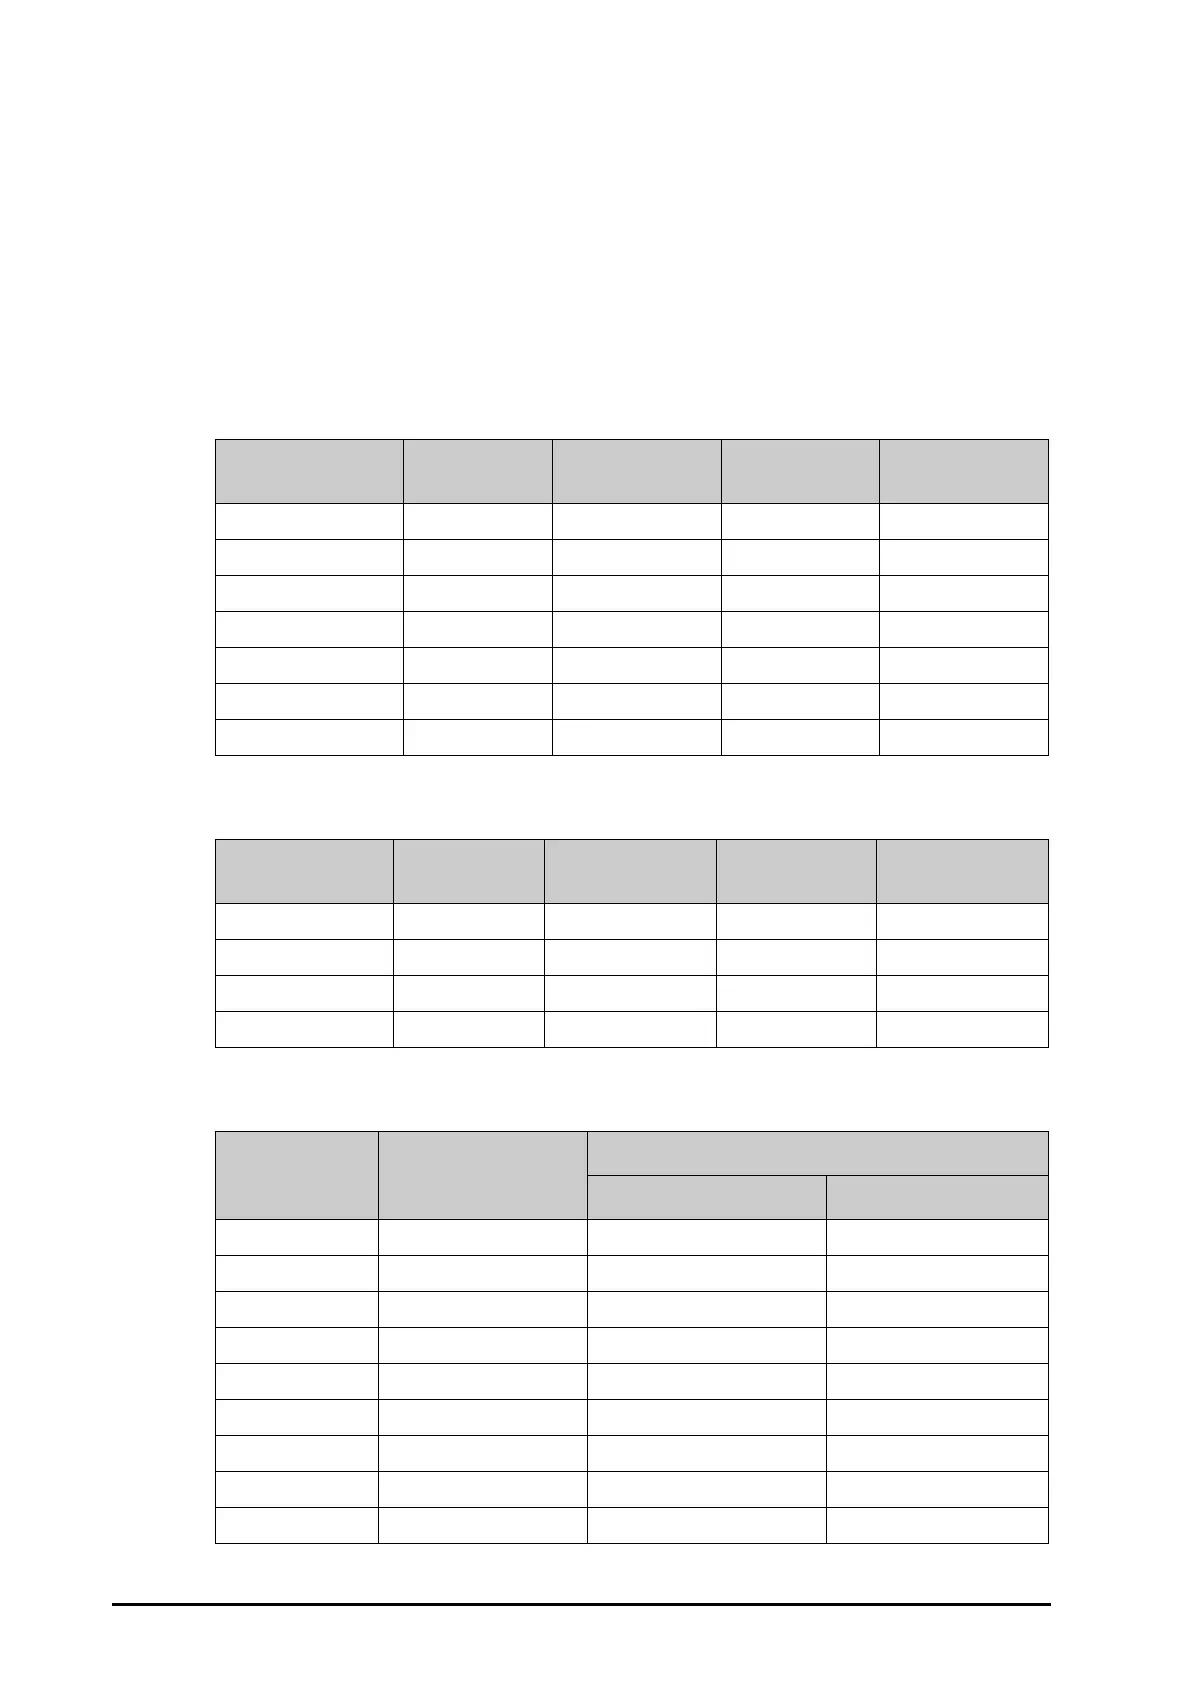
F.9 Evaluation results of absolute interval and wave duration
measurements
F.10 Evaluation results of interval measurements on biological ECGs
F.11 Evaluation results of stability of measurements against noise
MEASUREMENT
Mean Difference
(ms)
Acceptable
standard (ms)
Standard
Deviation (ms)
Acceptable
standard (ms)
P DURATION -10 ±10 2.256 SD<=8
QRS DURATION -0.143 ±6 2.413 SD<=5
PR INTERVAL -8.286 ±10 1.729 SD<=8
QT INTERVAL 1.385 ±12 6.501 SD<=10
Q DURATION -0.108 ±6 4.241 SD<=5
R DURATION 3.020 ±6 2.710 SD<=5
S DURATION -3.282 ±6 3.396 SD<=5
Measurement
Mean Difference
(ms)
Acceptable standard
(ms)
Standard
Deviation (ms)
Acceptable standard
(ms)
P Duration -2.708 ±10 10.194 SD <=15
QRS Duration -9.750 ±10 6.676 SD <=10
PQ Interval 2.458 ±10 7.182 SD <=10
QT Interval -4.500 ±25 14.483 SD <=30
Global
Measurement
Type of Added Noise
Disclosed Differences
Mean Difference (ms) Standard Deviation (ms)
P Duration High Frequency 1.4 9.192
P Duration Line Frequency (50Hz) -0.2 8.404
P Duration Line Frequency (60Hz) 0.8 5.181
P Duration Base-Line 4.2 8.244
QRS Duration High Frequency -0.6 2.119
QRS Duration Line Frequency (50Hz) 0 0.943
QRS Duration Line Frequency (60Hz) 0.4 1.265
QRS Duration Base-Line 0.8 3.553
QT Interval High Frequency -2.2 6.070