3 - 6
3.6 Screen Display
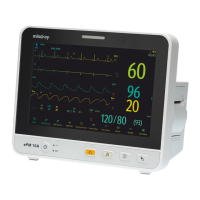
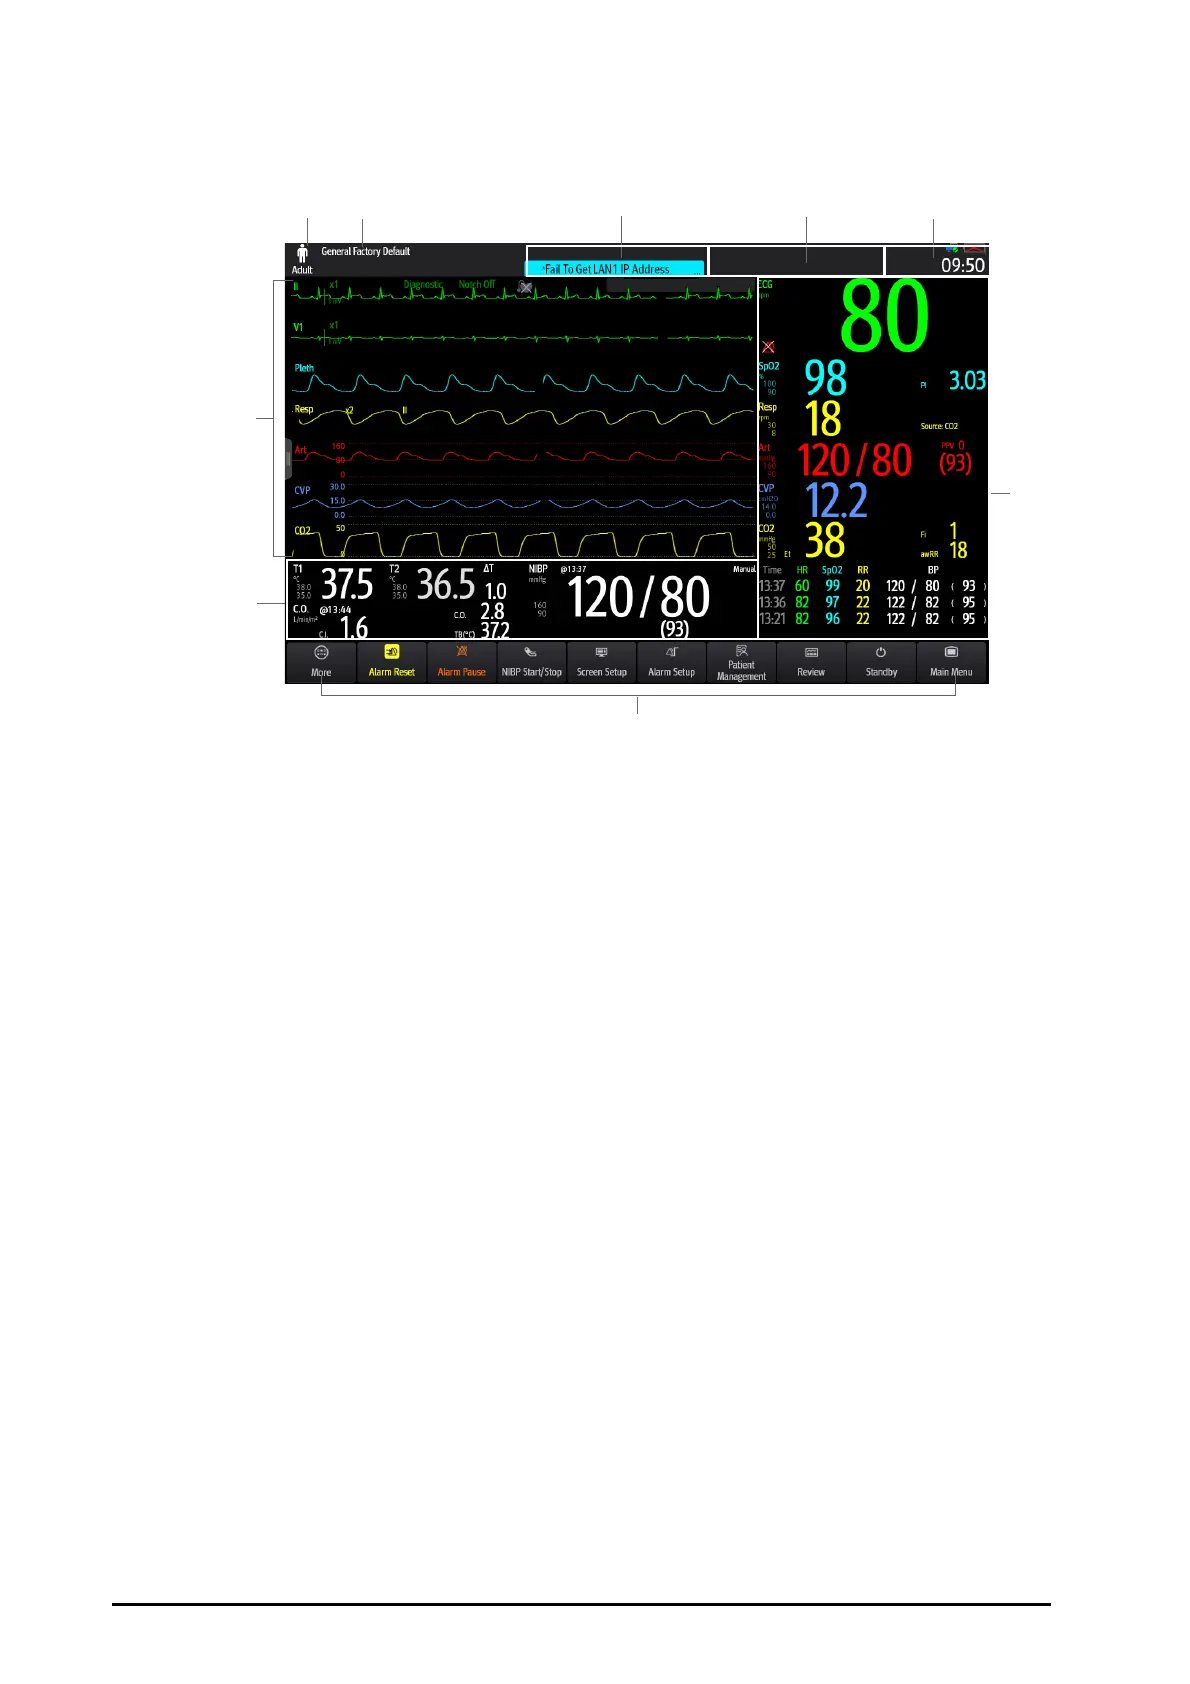
The following figure shows the normal screen:
(1) (2) (3) (4) (5)
(7)
(9)
(6)
(8)
(1) Patient information area: displays patient information, including patient category, gender, department, room
number, bed number, and so on. The displayed patient information is configurable. Selecting this area enters
the Patient Management menu. For more information, see 5.3Managing Patient Information.
(2) The current configuration
(3) Technical alarm information area: displays prompt messages on the above; displays technical alarm messages
at the bottom.
(4) Physiological alarm information area: displays high priority physiological alarms on the above; displays
medium and low priority physiological alarms at the bottom.
(5) System status information area: displays alarm symbol, battery status, network status, currently connected
CMS, storage device status, and system time. For more information, see 3.6.1On-screen Symbols.
(6) Parameter numerics area: displays parameter values, alarm limits, and alarm status. This area also displays
parameter list. Selecting a parameter numeric block enters corresponding parameter menu. Selecting the
parameter list enters tabular trend review. For more information, see 3.11.4Accessing Parameter Setup Menus.
(7) Quick key area: displays selected quick keys.
(8) Parameter waveform/numerics area: displays parameter waveforms, parameter values, alarm limits, and alarm
status. This area also displays parameter list. Selecting a parameter numeric area or waveform area enters
corresponding parameter menu. Selecting the parameter list enters tabular trend review. For more
information, see 3.11.4Accessing Parameter Setup Menus.
(9) Parameter waveform area: displays parameter waveforms and parameter alarms. Select a waveform enters
corresponding parameter menu. For more information, see 3.11.4Accessing Parameter Setup Menus.