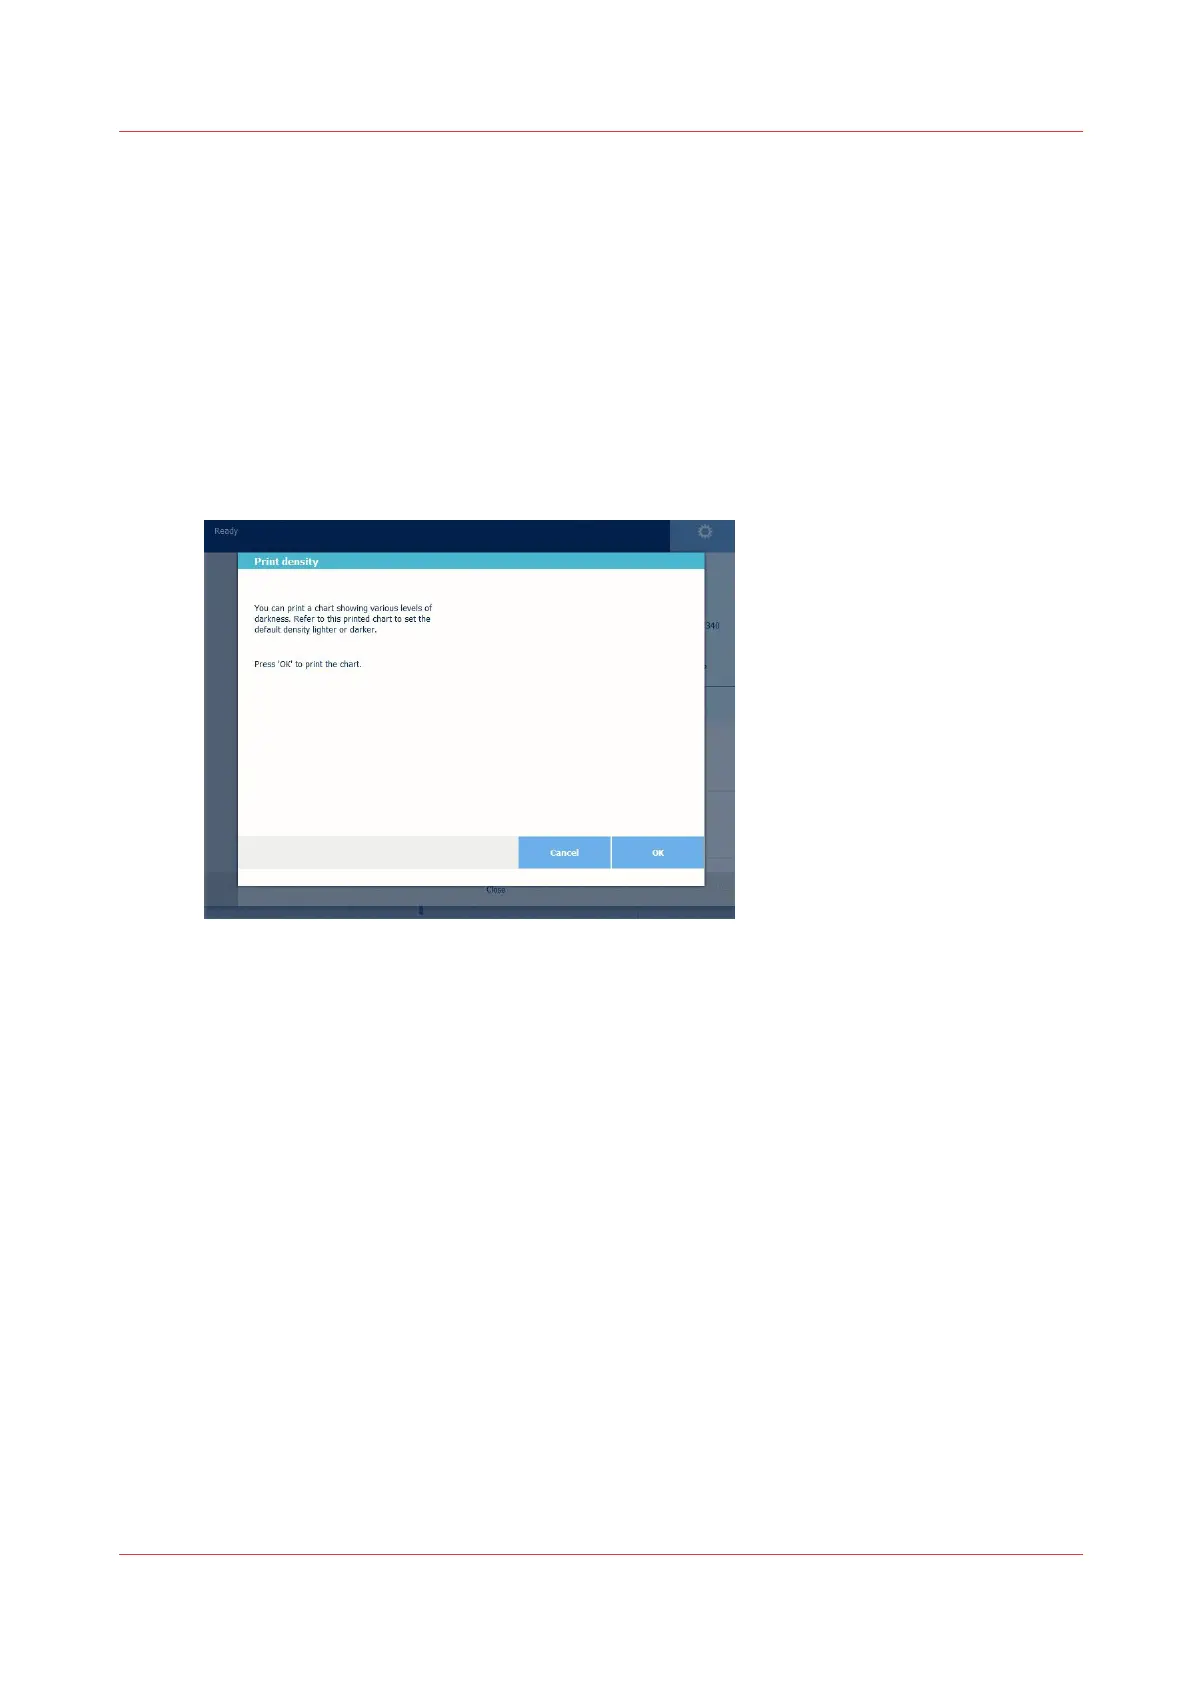
Print the print density chart
When to do
To influence the toner usage of your printer, you can print the print density chart and adjust the
print density offset. A negative value reduces the toner usage, a positive value increases the toner
usage.
Procedure
1.
Tap the system menu thumbnail. A window opens.
2.
In the list in the bottom right corner of the display, select [Test prints]. A wizard opens.
3.
Select [Print density chart].
4.
Tap Ok.
Result
A chart is printed.
Use the chart to change the print density in Océ Express WebTools, or via [Print density] on the
user panel. In order to change the print density settings, you must log in a Key operator or Power
user.
Print the print density chart
Chapter 8 - Support
319