Common Analysis and Display Functions
R&S
®
FSVA3000/ R&S
®
FSV3000
506User Manual 1178.8520.02 ─ 01
Example:
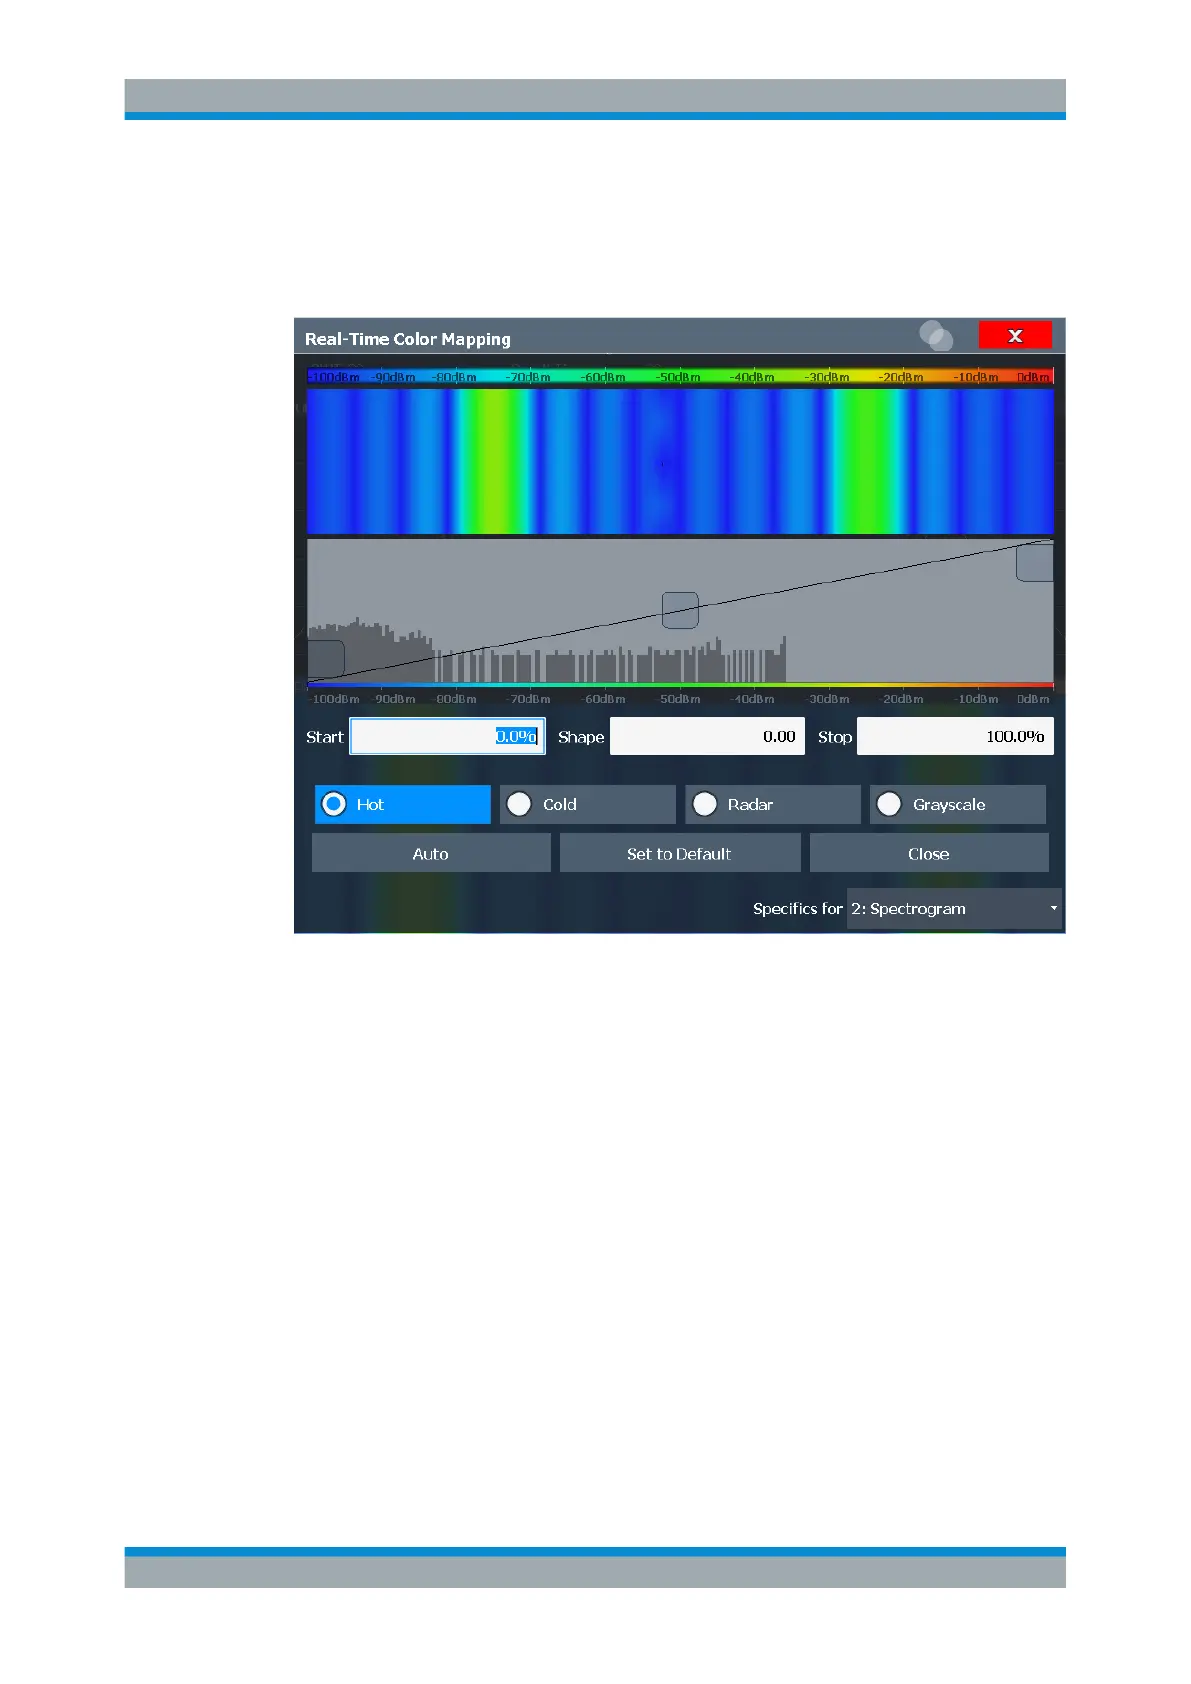
In the color map based on the linear color curve, the range from -100 dBm to -60 dBm
is covered by blue and a few shades of green only. The range from -60 dBm to
-20 dBm is covered by red, yellow and a few shades of green.
Figure 9-16: Spectrogram with (default) linear color curve shape = 0
The sample spectrogram is dominated by blue and green colors. After shifting the color
curve to the left (negative value), more colors cover the range from -100 dBm to
-60 dBm (blue, green and yellow). This range occurs more often in the example. The
range from -60 dBm to -20 dBm, on the other hand, is dominated by various shades of
red only.
Trace Configuration

 Loading...