Common Analysis and Display Functions
R&S
®
FSVA3000/ R&S
®
FSV3000
507User Manual 1178.8520.02 ─ 01
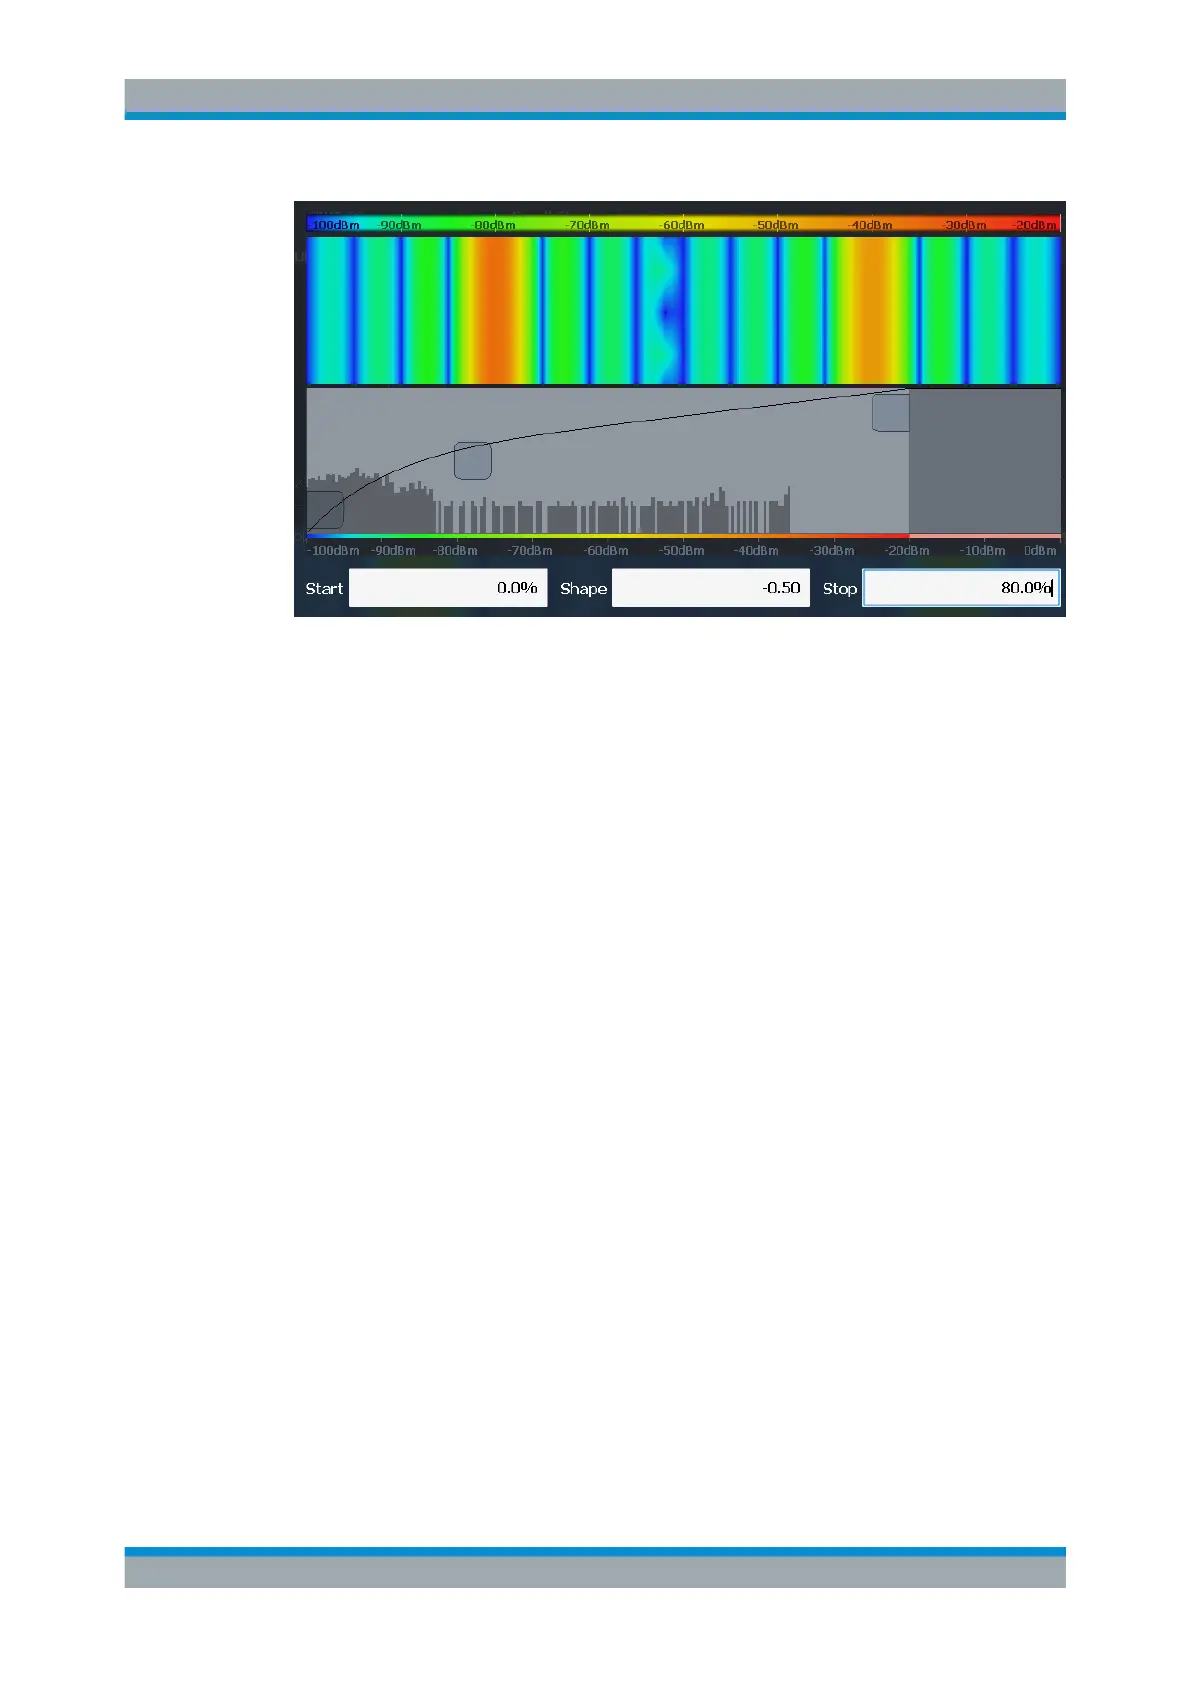
Figure 9-17: Spectrogram with non-linear color curve (shape = -0.5)
9.5.2.2 Spectrogram Settings
Access: [TRACE] > "Spectrogram Config"
The individual settings available for spectrogram display are described here. For set-
tings on color mapping, see "Color Map Settings" on page 510.
Settings concerning the frames and how they are handled during a sweep are provided
as additional sweep settings for spectrogram display.
See Chapter 8.5, "Bandwidth, Filter and Sweep Configuration", on page 376.
Search functions for spectrogram markers are described in Chapter 9.3.3.2, "Marker
Search Settings for Spectrograms", on page 437.
● General Spectrogram Settings..............................................................................507
● Color Map Settings................................................................................................510
General Spectrogram Settings
Access: [TRACE] > "Spectrogram Config"
This section describes general settings for spectrogram display.
Trace Configuration

 Loading...


