11/8/00 System 824 Views 6-39
The following explains each of the display’s components:
Display label
- This shows the current display (for example,
“
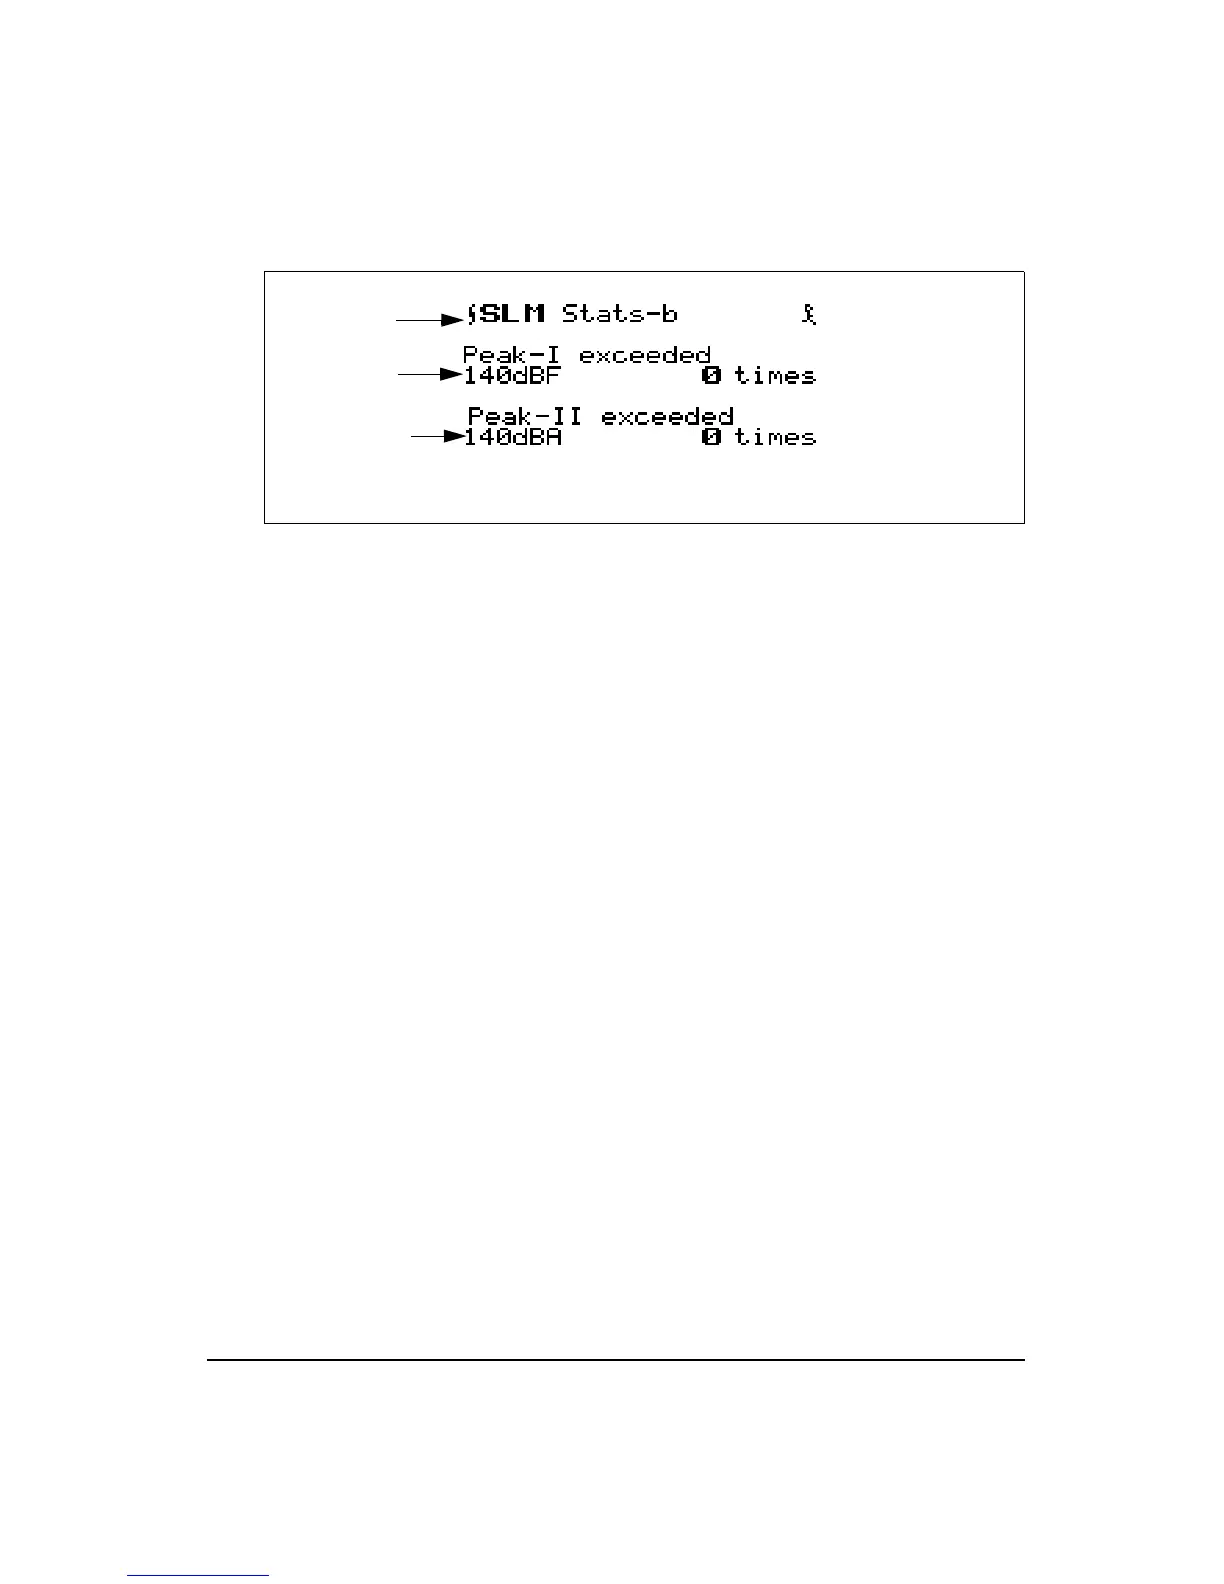
SLM Stats-b
”).
Peak-I trigger
- This presents a summary of the number of
times during the overall measurement that the Peak-I level
exceeded its pre-programmed trigger level. In this example,
Peak-I’s trigger level is set to 140dBF and the Peak-I level
exceeded this threshold 0 times. These may be considered as
individual events.
Peak-II trigger
- This presents a summary of the number of
times during the overall measurement that the Peak-II level
exceeded its pre-programmed trigger level. In this example,
Peak-II’s trigger level is set to 140dBA and the Peak-II level
exceeded this threshold 0 times. These may be considered as
individual events.
Stats-c Display
The
Stats-c
display consists of two major components:
•Display label
• Overload message
The
Stats-c
display is shown below:
Display label
Peak-I trigger
Peak-II Trigger