6-12 824 Reference Manual 11/8/00
Step 1
Press the
c
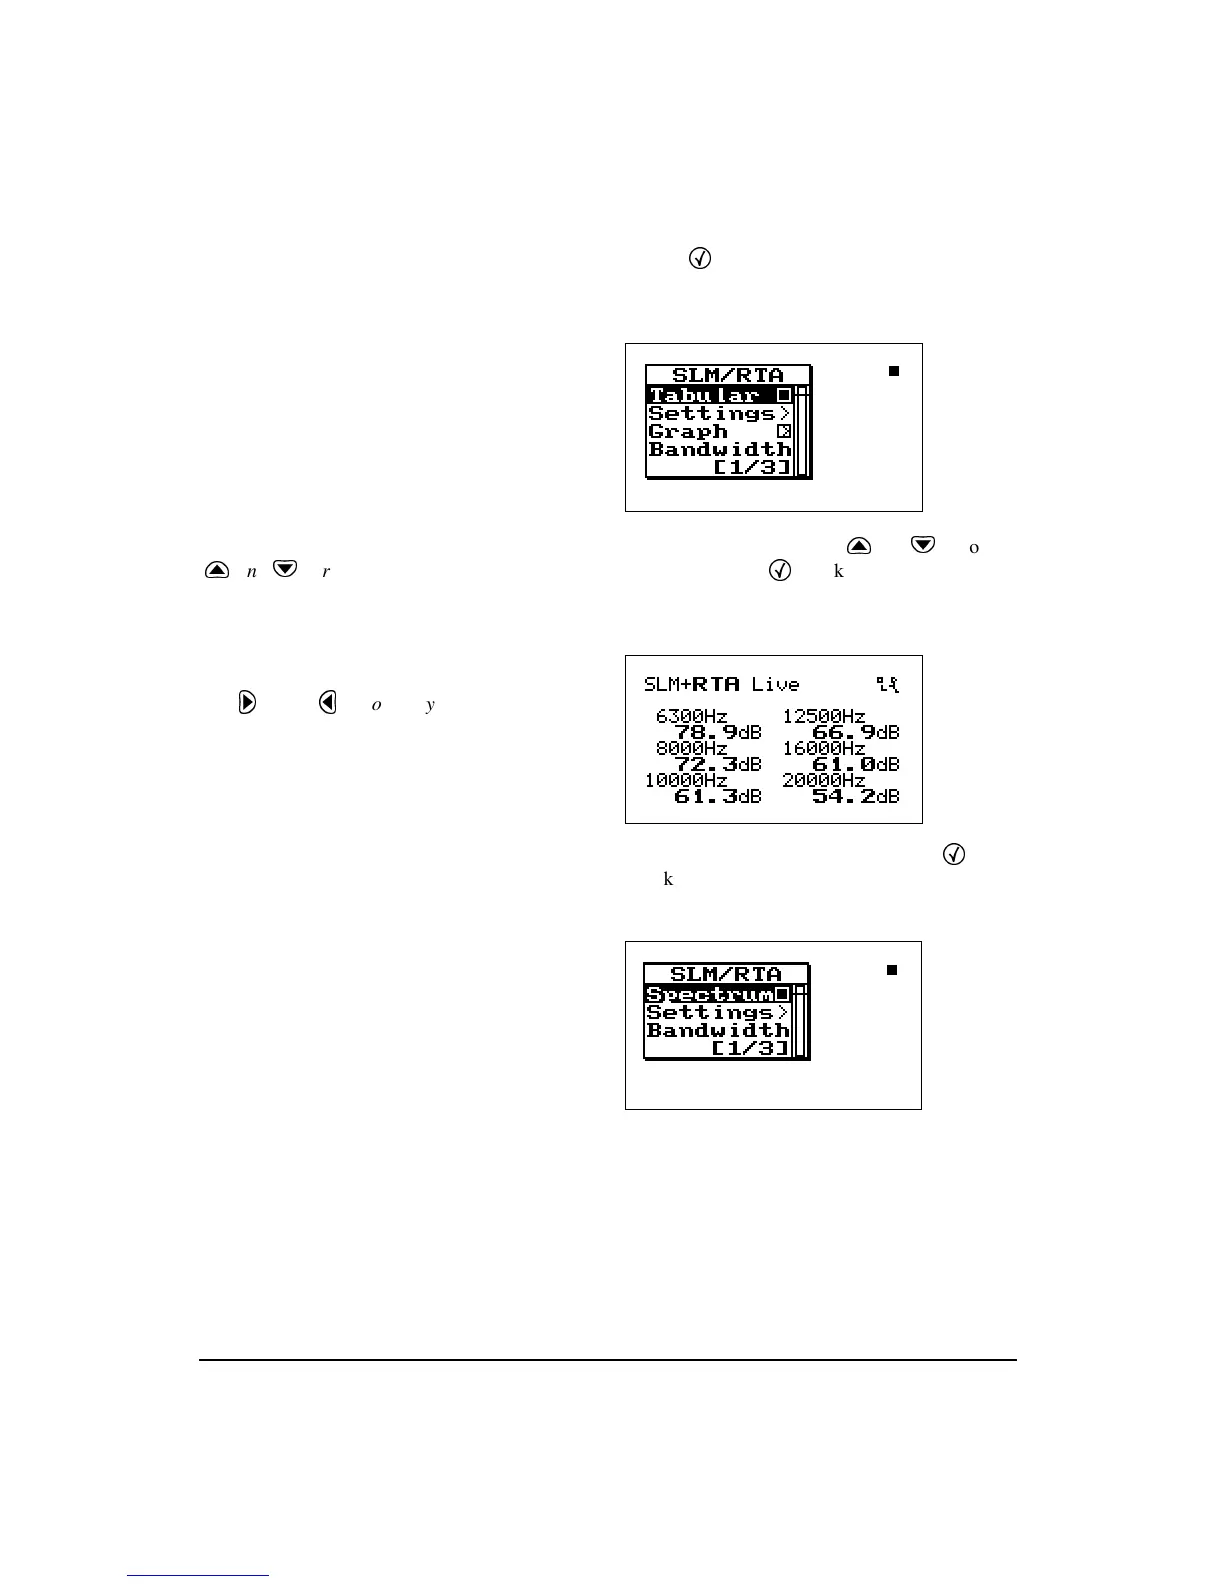
Check key while in the
RTA Live
,
RTA Leq
, or
RTA Max
graphical views. The fol-
lowing menu appears:
While in the main tabular view, the
u
and
d
arrows keys cycle you
through the different spectra’s (i.e.
RTA Live, RTA Max, and RTA L
eq
)
tabular displays.
Step 2
Highlight
Tabular
using the
u
or
d
arrow
keys then press the
c
check key. A tabular dis-
play like the following screen appears:
Step 3
To return to the graphical view, press the
c
check key and the following menu appears:
Select “Spectrum” to view the graph again.
Time History Displays
The following are examples of the graphical displays for the
SLM Time History
and
RTA Time History
Views:
The
r
and
l
arrow keys move
you through a series of tabular dis-
plays showing the current spectra’s
dB readings at each center fre-
quency.