11/8/00 RTA (optional) 10-29
ByTime Graph
The Autostore ByTime Graph display is a time graph of just
one filter frequency, plotted with time as the horizontal axis.
This graph is useful in seeing the level “rise or fall” charac-
teristics of each individual filter.
The
u
up and
d
down arrow keys move you through
each filter. The
l
left and
r
right arrow keys move to
the previous and next ByTime sample.
ByTime Spectrum Check Menu
As discussed earlier, in order to move between the ByTime
spectrum display and the ByTime Graph display you pressed
the
c
check key twice (toggling between the ByTime Spec-
trum view and the ByTime Graph view). Pressing the
c
check key once when viewing the ByTime spectrum display
puts you in the check menu. The check menu is shown
below:
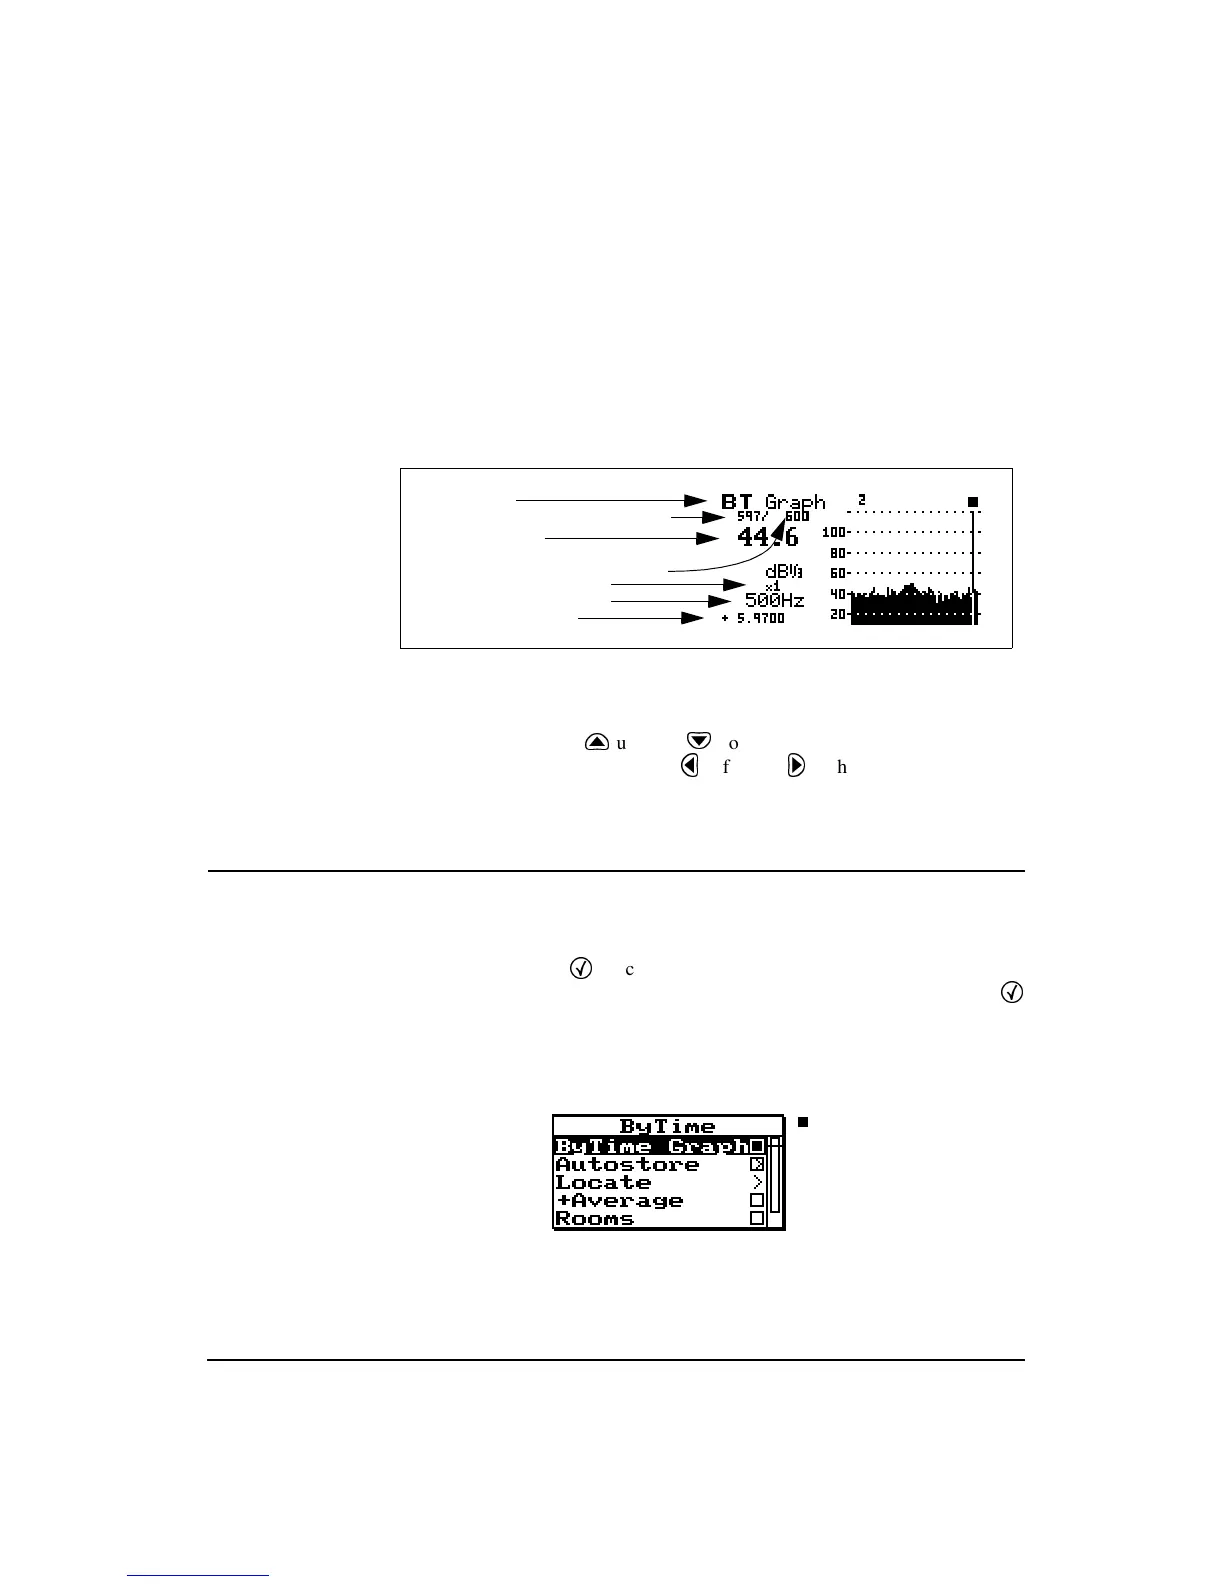
Display label
Autostore record number
Current ByTime sample number
Filter level in dB
Total number of Bytime samples
ByTime sample time
Horizontal graph scaling
Selected filter frequency