10-28 824 Reference Manual 11/8/00
Autostore ByTime Spectral History
The Autostore ByTime spectral history has two displays for
viewing the time history data. The first is called the
ByTime
Spectrum
and the second is called the
ByTime Graph.
ByTime Spectrum
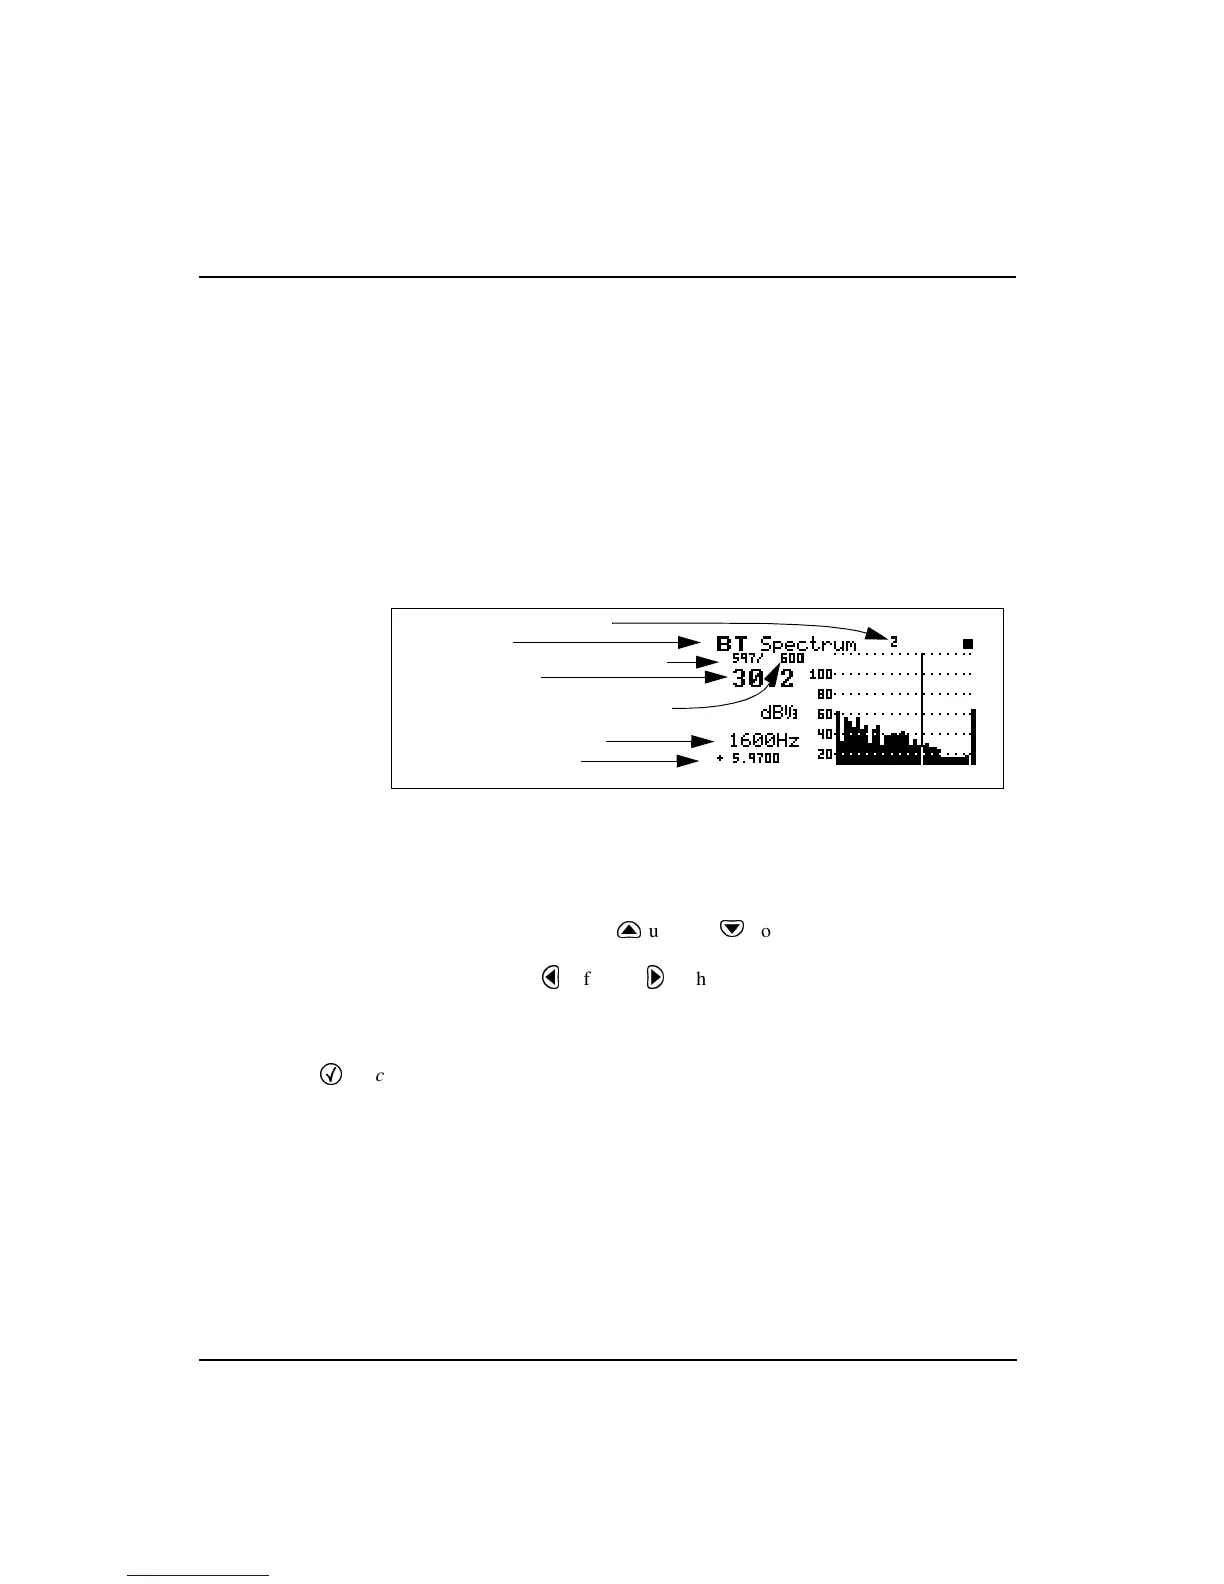
The Autostore ByTime Spectrum display shows just one
sample in time and the entire frequency spectrum with fre-
quency on the horizontal axis.
This ByTime display shows that 600
spectra were taken and we are cur-
rently looking at record number 597.
With the
u
up and
d
down arrow keys you can view
each ByTime spectrum sample that was recorded. Use the
l
left and
r
right arrows to move the cursor to look at
each individual frequency.
To move to the ByTime Graph dis-
play, press the
c
check key twice.
NOTE: Notice as you move through each ByTime sample that the
sample time changes. A minus sign in front of the time indicates
that they are pretrigger samples. 0 is the point where the trigger
occurred.
Display label
Autostore record number
Current ByTime sample number
Total number of ByTime samples
Selected filter frequency
Filter level in dB
ByTime sample time