11/8/00 System 824 Views 6-11
SSA Displays
All of the following views can be accessed through the
V
View key when using the SSA instrument.
Additionally, the
RTA Live
,
RTA L
eq
,
RTA Max
and
RTA
Min
can be easily switched between each other by using the
u
or
d
to move to any of the other views. The
r
or
l
arrow keys
can used to move the cursor.
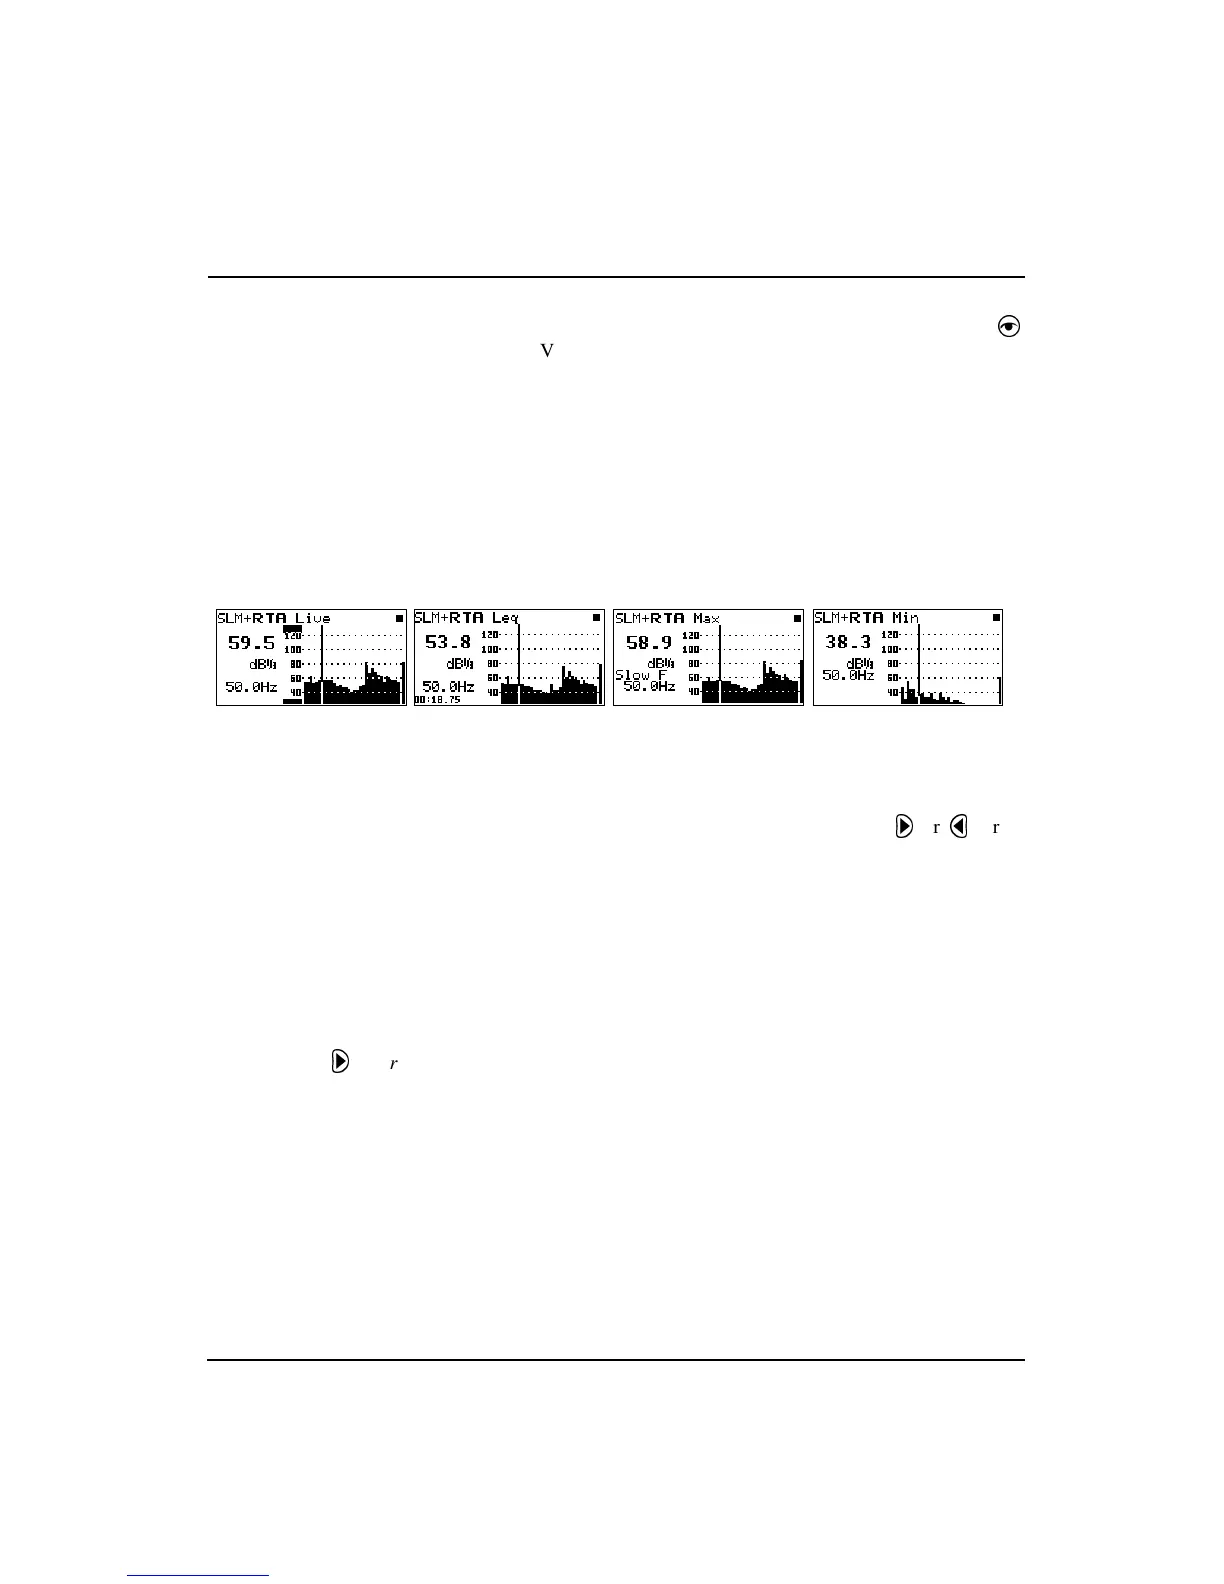
RTA Displays
The following are examples of the graphical displays for the
RTA Live
,
RTA Leq
,
RTA Max,
and
RTA Min.
In the above views the cursor position (the vertical bar in the
graph) corresponds to the level and frequency values shown.
the left side of the display. The cursor or (frequency bar
position) can be changed by pressing the
r
or
l
arrow
keys. As the arrow keys are pressed, the vertical bar moves
to the appropriate position and the frequency readout
changes accordingly.
Tabular RTA Views
The Tabular display can also be
accessed from the main View menu
by highlighting the desired RTA view,
pressing the
r
arrow key, and
then selecting Tabular from the sub-
menu that appears.
In addition to a graphical view, a tabular display is also
available for the
RTA Live
,
RTA Leq
, or
RTA Max
modes
which shows a tabular listing of the dB readings at specified
frequency levels in each of these spectra. To access the tabu-
lar displays do the following: