11/8/00 System 824 Views 6-9
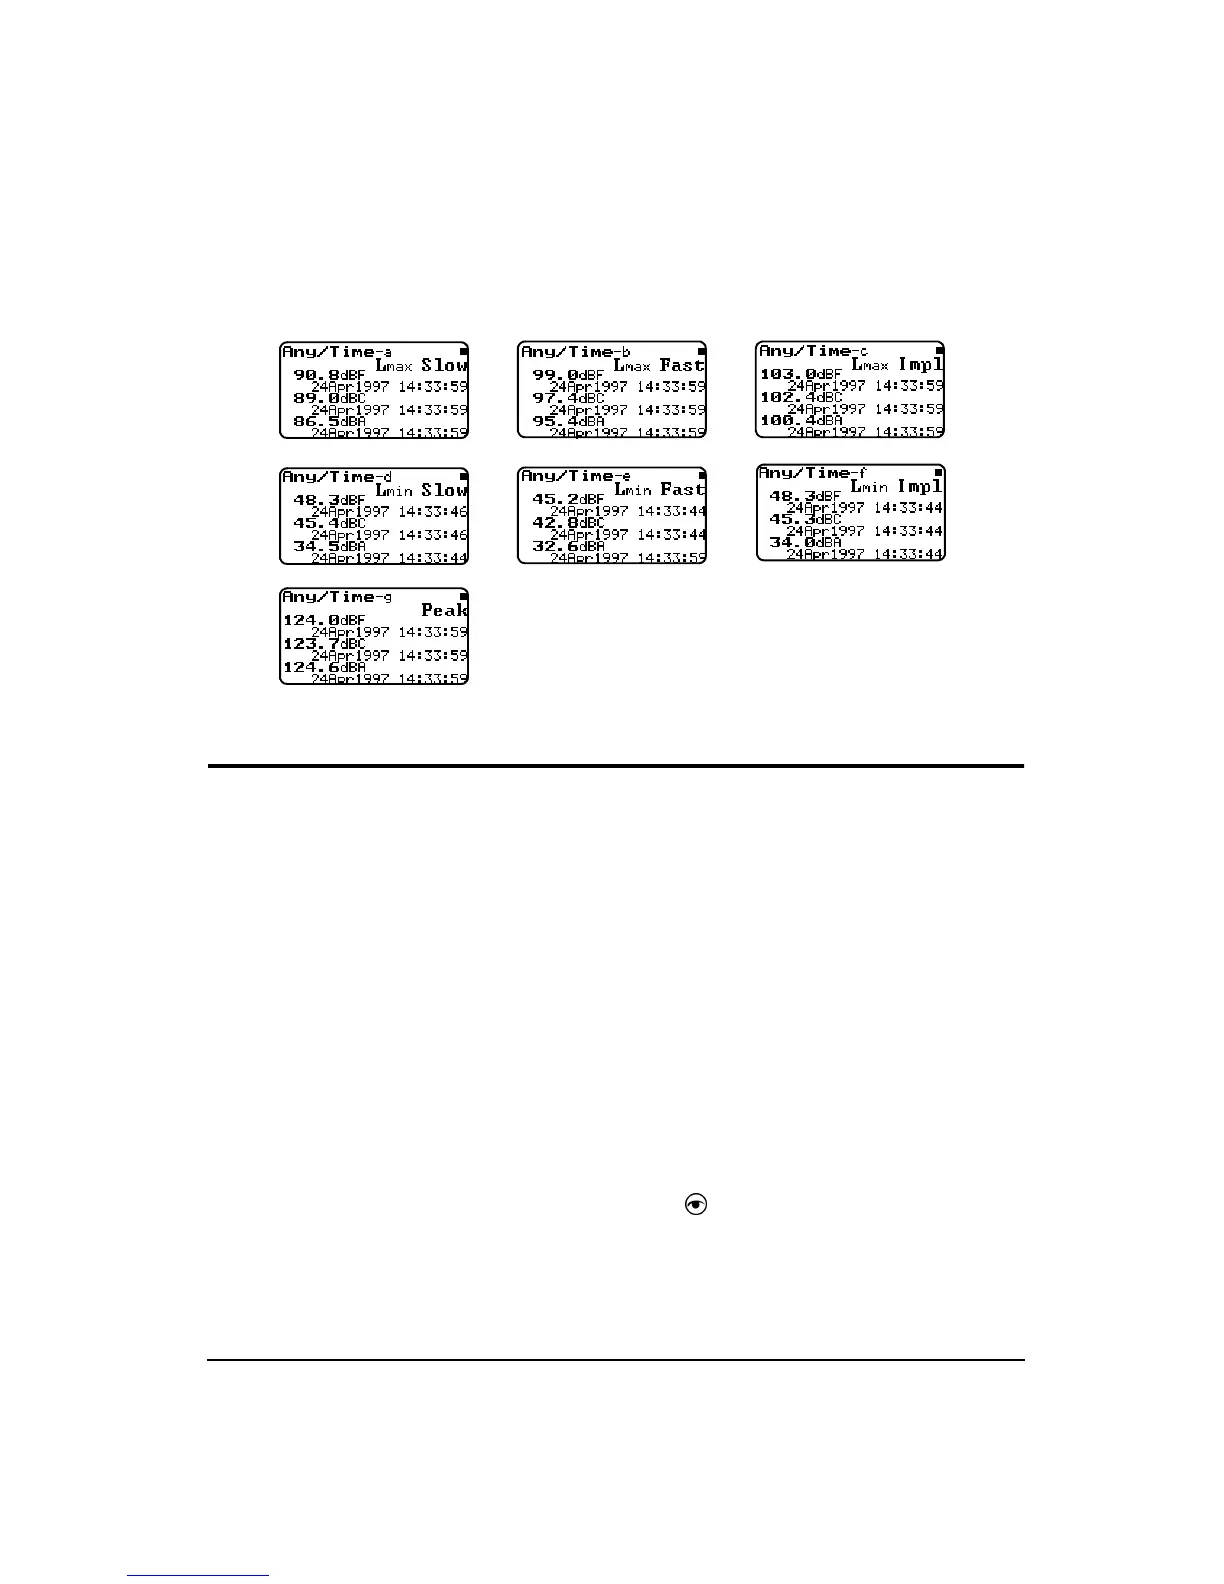
(Fast, Slow, and Impulse) and Lpeak measured with A, C
and Flat weighting as follows:
SSA Specific Views
The System 824 has various displays for the SSA instru-
ment. Understanding these displays lets you take full advan-
tage of this instrument.
In addition to the
SLM
and
Any Data
views described ear-
lier in this chapter, there are four spectral displays available
in the SSA instrument; the
RTA Live
(instantaneous) spec-
trum, the
RTA Leq
or time weighted averaged (since last
reset) spectrum,
RTA Max
spectrum, which is the spectrum
time coincident with the maximum value of the SPL during
the measurement interval and
RTA Min
, which shows the
minimum level obtained by each filter during the measure-
ment interval. There are also displays for the Interval His-
tory, the Time History, the Run Log and for Ln Centiles.
Like all of the System 824 displays, these views are
accessed via the
V
View key as described earlier in the
“General Views” section of this chapter.