6-10 824 Reference Manual 11/8/00
The following briefly describes the main views available to
the SSA instrument.
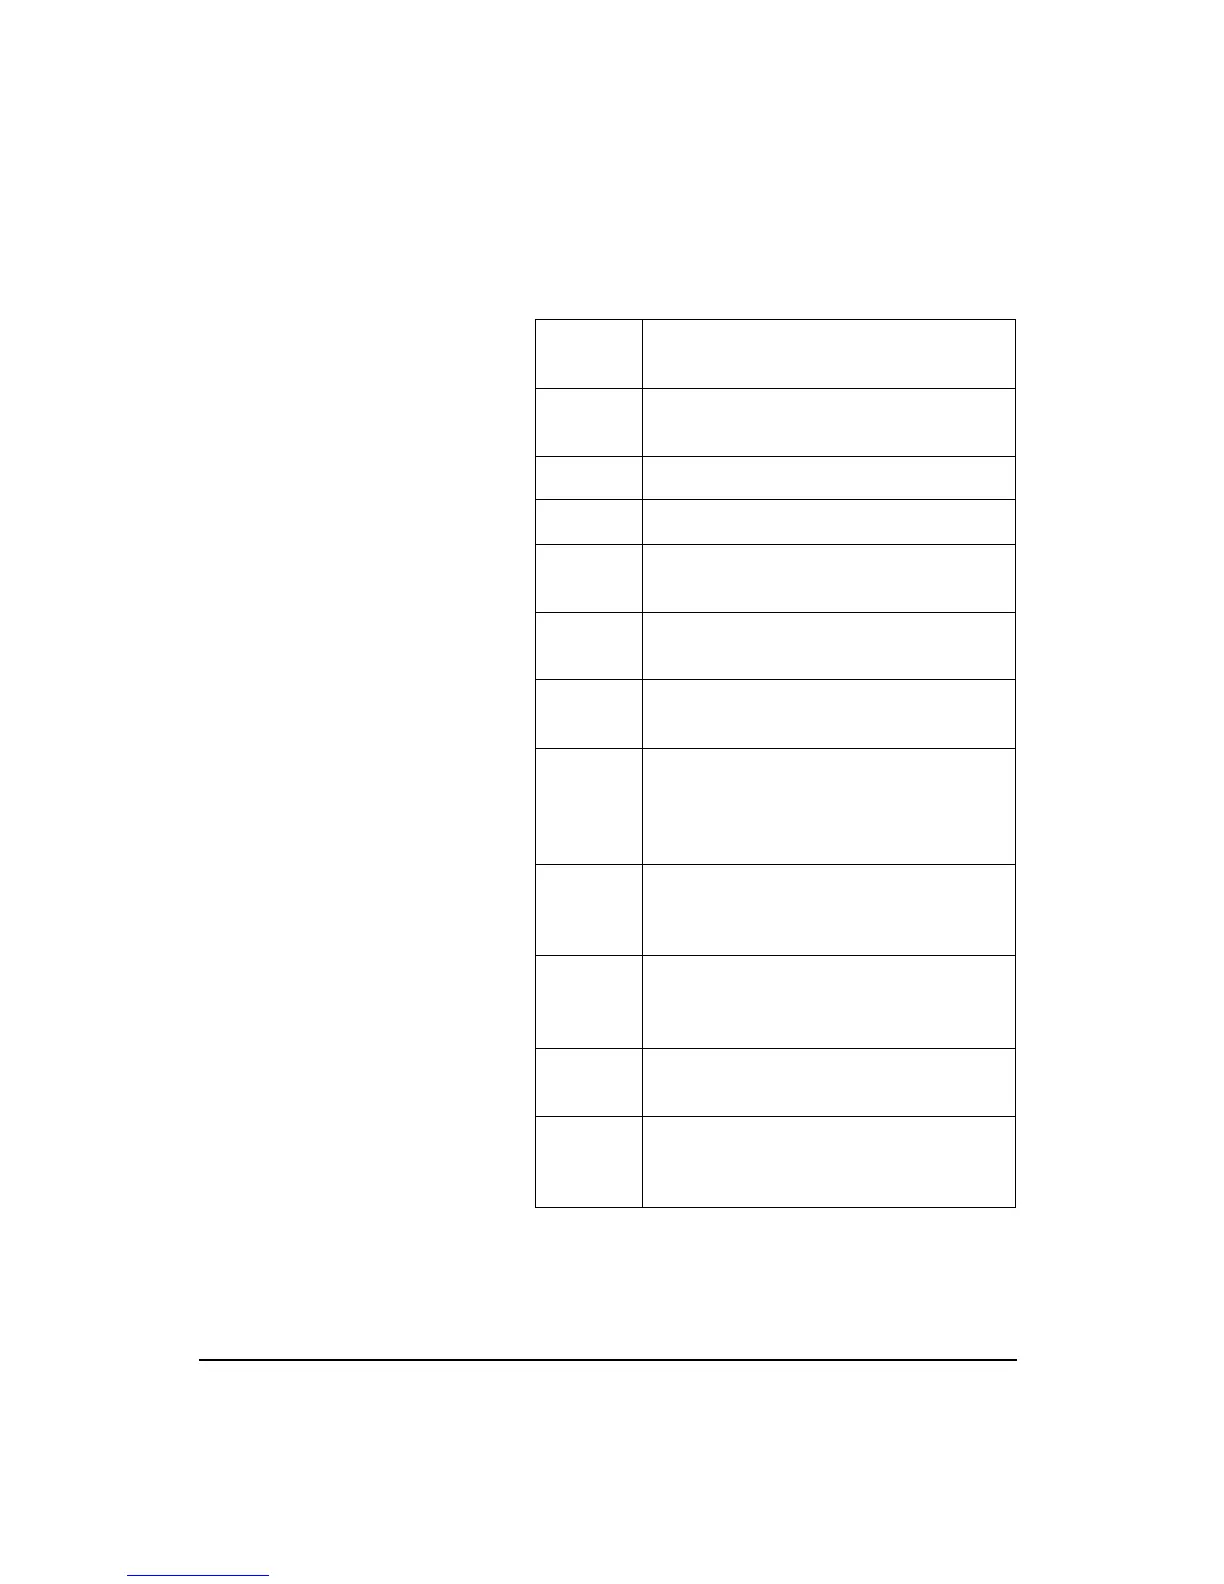
Menu
Items
Purpose
SLM SLM data with graphic display of Time
History.
Any Data Tabular display of SLM data
RTA Live Real-time frequency analysis display
RTA Leq Leq frequency analysis display since the
last reset
RTA Max Frequency spectrum associated with the
highest SPL RMS level since the last reset
RTA Min The minimum level recorded for each fre-
quency during the measurement.
Intervals Shows an Leq spectrum, Max or Min spec-
tral data, a broadband Leq, Lmax, Lmin,
SEL, Lpeak and Spectral Lns for each
interval period.
SLM
Time His-
tory
Shows the Leq for each time history period
in graphical form plus the selected
advanced T.H. items.
RTA Time
History
Live/Leq
Shows the spectral data for each time his-
tory period.
Run Log Displays the start and stop times/dates of
the active measurement
Ln Cen-
tiles
Ln percentile levels exceeded ‘n’ percent of
the measurement time for broadband and
spectral data.
To store interval spectral Ln levels,
set “Spectral Ln” to “Interval”,
enable Ln and Interval histories and
set “Intv Save Ln” to “Yes”.