11/8/00 System 824 Views 6-13
The up
u
and down
d
arrow keys change the record
you are viewing. The
r
or
l
arrow keys change the pos-
tion of the cursor.
SSA Intervals (only available
when the LOG option is
installed)
See pages 6-44 to 6-48 for a descrip-
tion of the Interval-a through Inter-
val-d displays.
The Interval History shows a record of various sound pres-
sure data and spectral data (including spectral LNs) gathered
in time segments over the run time of the 824. An example
would be a measurement where data is gathered in one hour
time intervals over a 24 hour period.
Only Min or Max can be displayed.
The SSA instrument has 4 unique interval displays which
show the
Max
spectra (at the time the broadband level was at
maximum),
Min
spectra
,
which is a bin by bin minimum, the
Leq
or average of each frequency over the interval period
and
Leq By Time
which shows the level for each frequency
from each interval record over time.
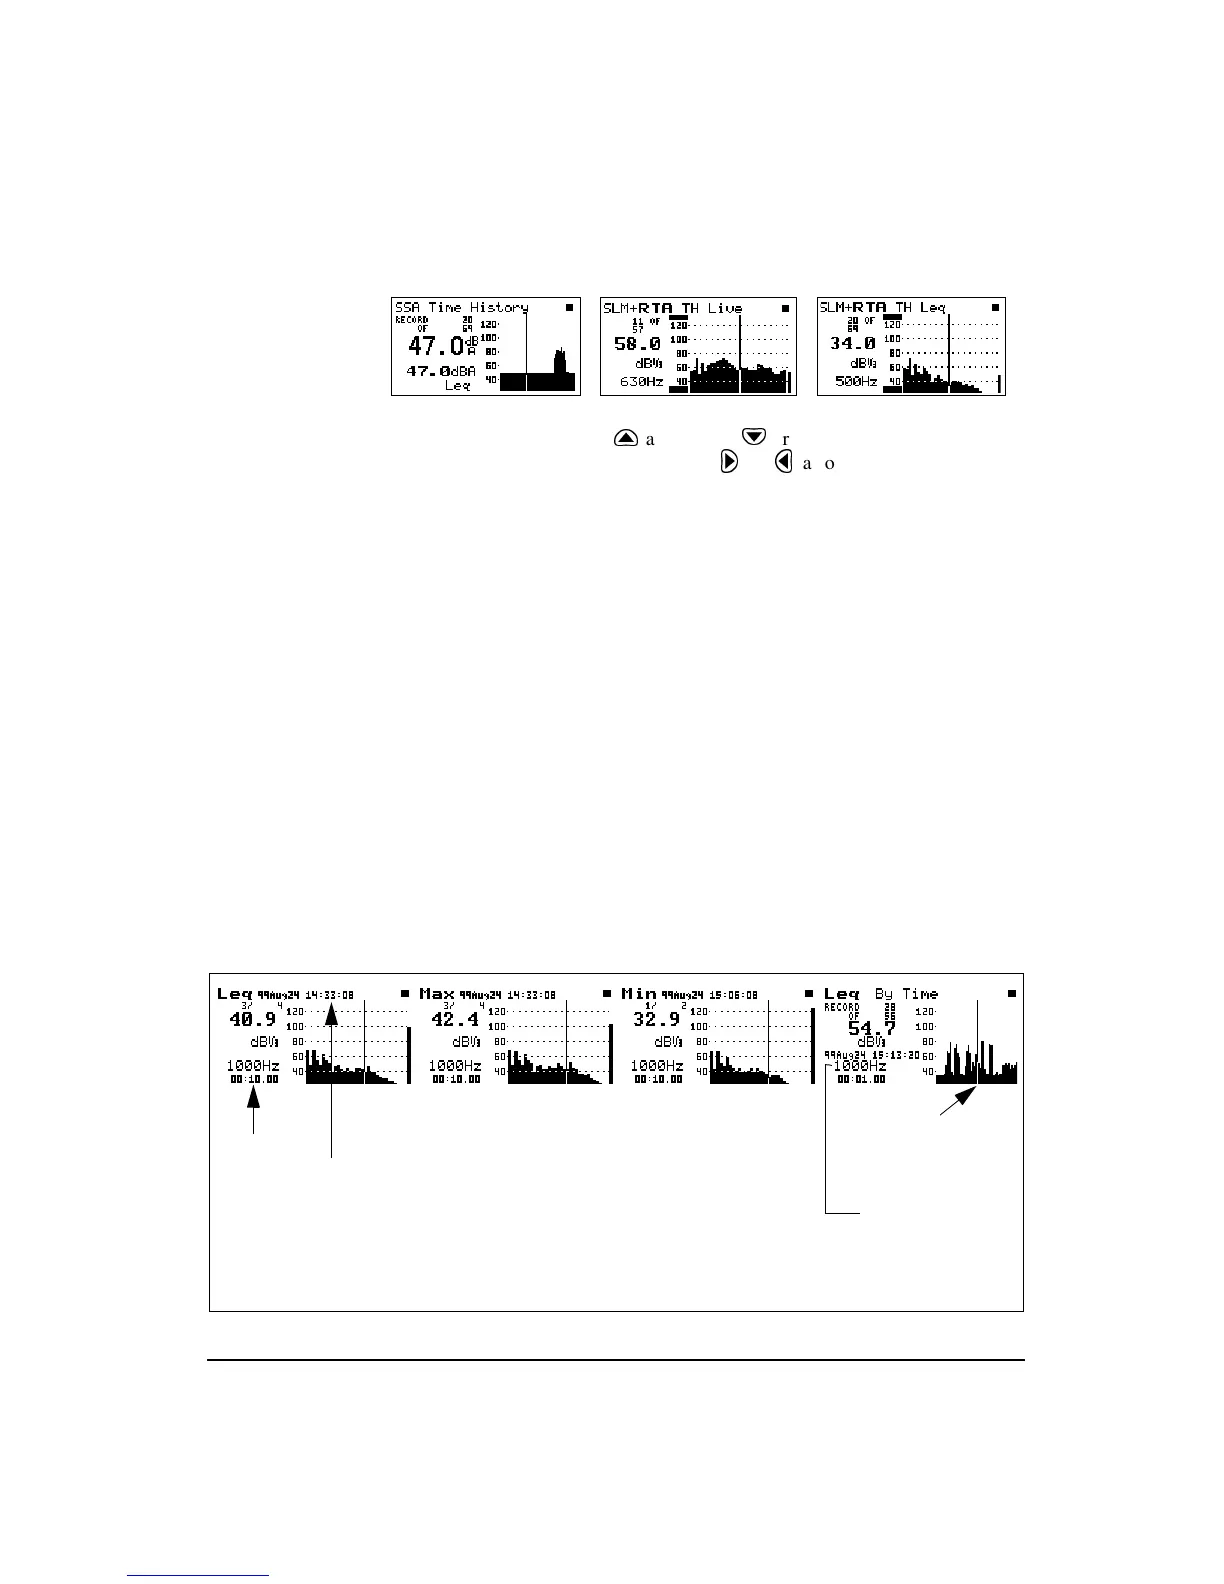
The following are examples of the interval displays:
The cursor shows
the level for the
interval record
selected
The up and down
arrow keys change
the frequency
displayed
The
Min
display shows
the bin by bin minimum
level for the interval
period
The
Max
displays shows
the spectrum correspond-
ing to the maximum
broadband level during
the interval period
Interval period
Time of interval
The
Leq
display shows
the average level for
each filter during the
interval period