11/8/00 Quick Start 4-7
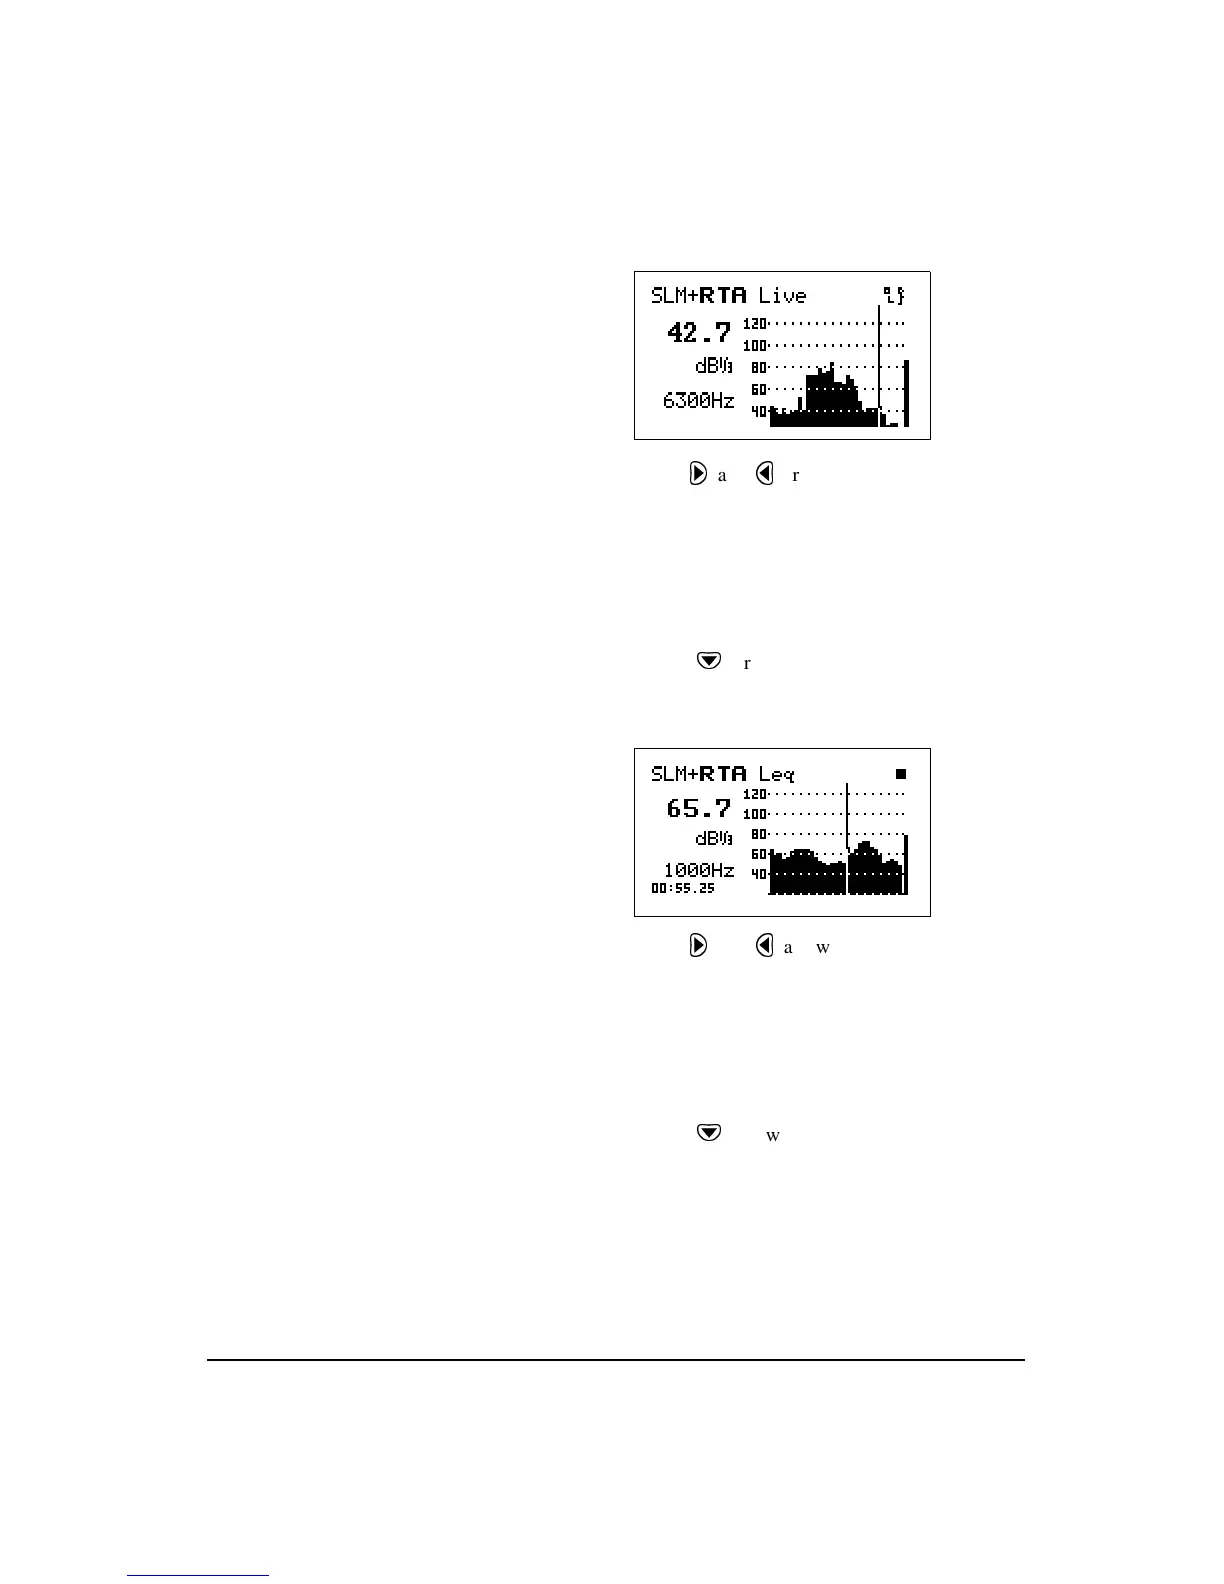
The RTA Live screen shows a graph-
ical display of the sound readings
over a range of frequencies. The SPL
for the selected frequency is dis-
played in the upper left corner. The
frequency, as selected by the vertical
cursor, is displayed in the lower left
corner.
As the frequency is changed the cur-
sor (vertical bar) will move accord-
ingly across the graphical display,
highlighting the corresponding
graphical sound reading. Addition-
ally, the digital frequency display
will also change as will the digital
readout of the sound measurement
for the newly selected frequency.
Step 4
Use the
r
and
l
arrow keys to change the
selected frequency. As the selected frequency is
changed, the SPL for that frequency will be dis-
played in the upper left corner. Additionally, the
cursor bar will move along the graph to the posi-
tion that corresponds to the SPL graphical display
for that particular frequency.
Step 5
Press the
d
arrow key to change to the
RTA Leq
view. A screen similar to the following appears:
The RTA Leq view shows a graphical
display of average sound exposure
for the measurement time. The LEQ
for the selected frequency is dis-
played in the upper left corner. The
selected frequency is displayed in the
lower left corner. When the cursor is
moved to the far right side,the
broadband Leq is shown numerically
and the cursor is no longer displayed
(as shown here).
Step 6
Use the
r
and
l
arrow keys to change the
selected frequency. As the frequency is changed,
the L
eq
for that frequency will be displayed in the
upper left corner. Additionally, the cursor bar will
move along the graph to the position that corre-
sponds to the L
eq
graphical display for that partic-
ular frequency.
Step 7
Press the
d
arrow key to change to the
RTA
Max
view. A screen similar to the following
appears: