292 Chapter 30: Inputs
PRO Series Live Audio Systems
Owner’s Manual
Compressor graph
This section uses examples to illustrate the affect on the compressor graph of adjusting
the compressor’s parameters.
Ratio
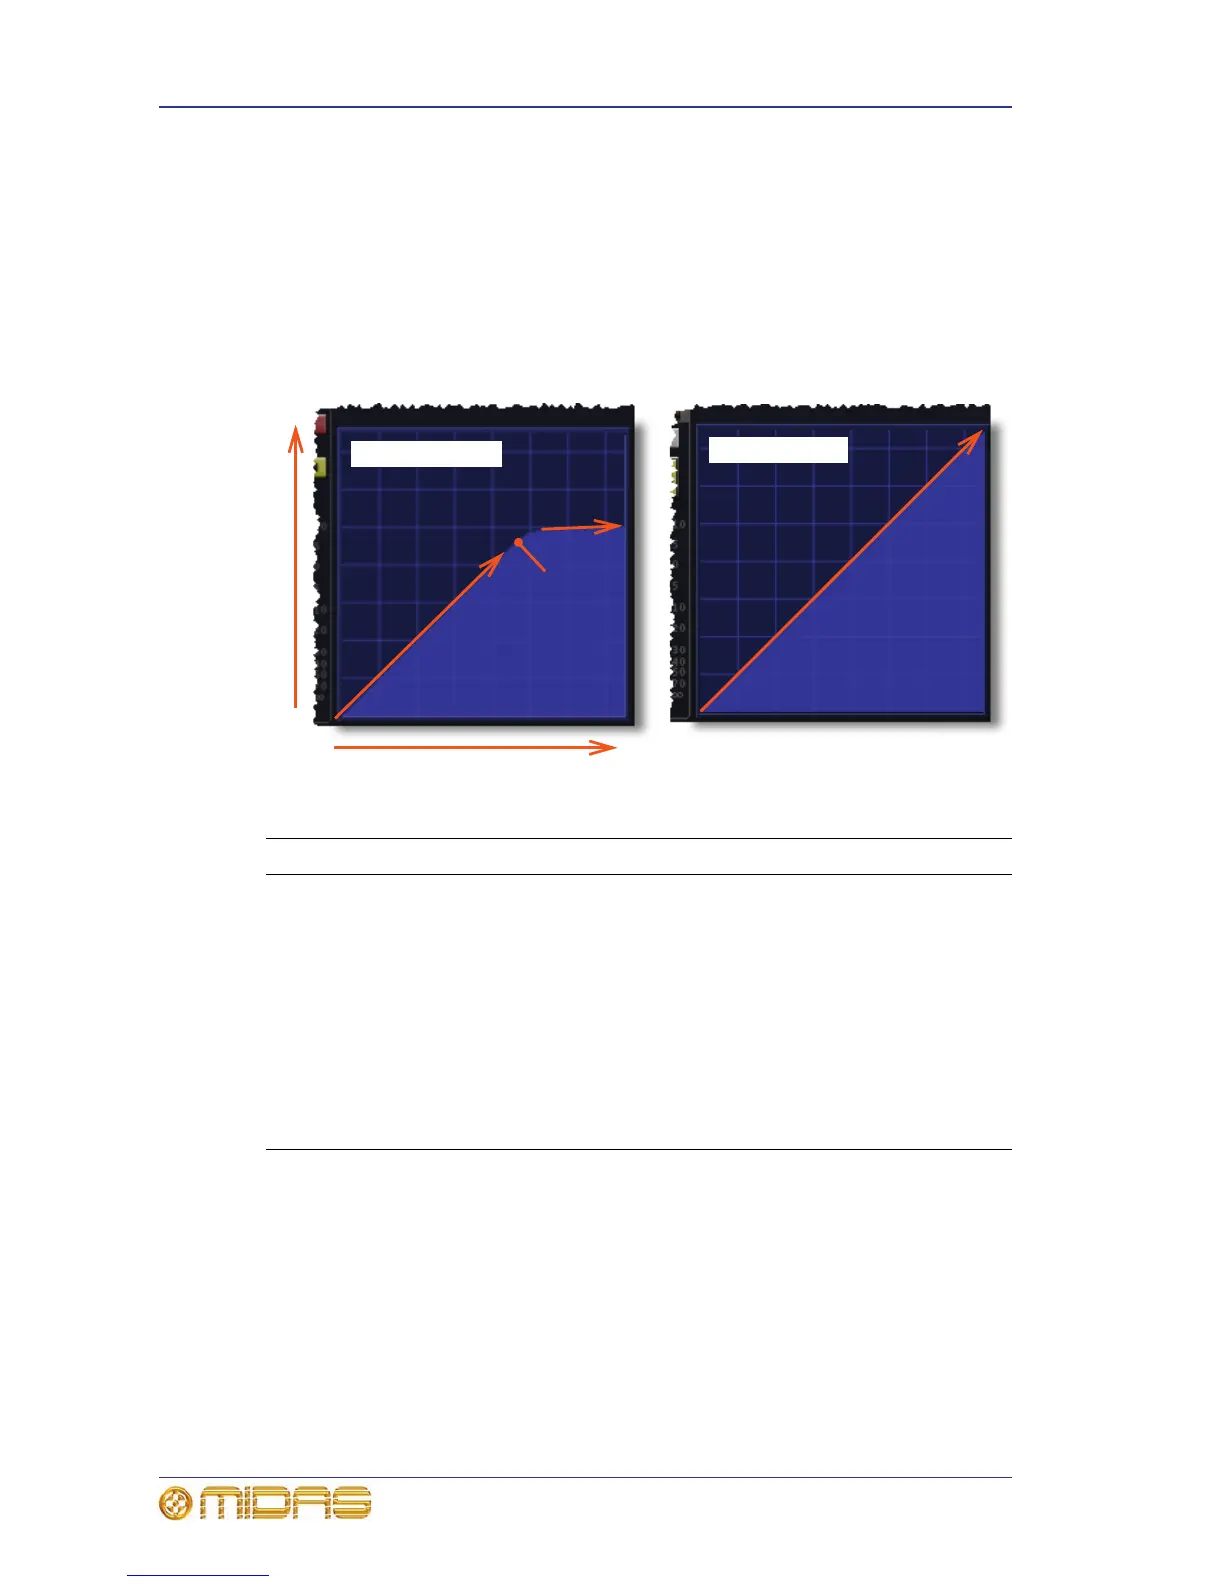
The following diagram shows a signal on the compressor graph with ratio applied; it
shows the point of threshold and how ratio affects the gradient of the signal following
this. The graph on the right shows an uncompressed signal, that is, with no ratio
applied.
Graphs showing the effect of applying ratio
Item Description
1 Input level The ‘x-axis’ of the graph.
2 Output level The ‘y-axis’ of the graph.
3 This portion of the graph is pre-threshold and is unaffected by compression,
that is, with a gradient of 1:1.
4 This portion of the graph is post-threshold and shows the effects of
compression. The gradient is the same as the compression ratio.
5 Threshold The point where the gradient changes and where compression
starts to be applied.
6 Graph with no ratio applied, that is, 1:1 gradient. (What you put into the
compressor, you get out.)