Common Analysis and Display Functions
R&S
®
FSVA3000/ R&S
®
FSV3000
511User Manual 1178.8520.02 ─ 01
For more information on color maps see "Color Maps" on page 503. For details on
changing color mapping settings see "How to Configure the Color Mapping"
on page 514.
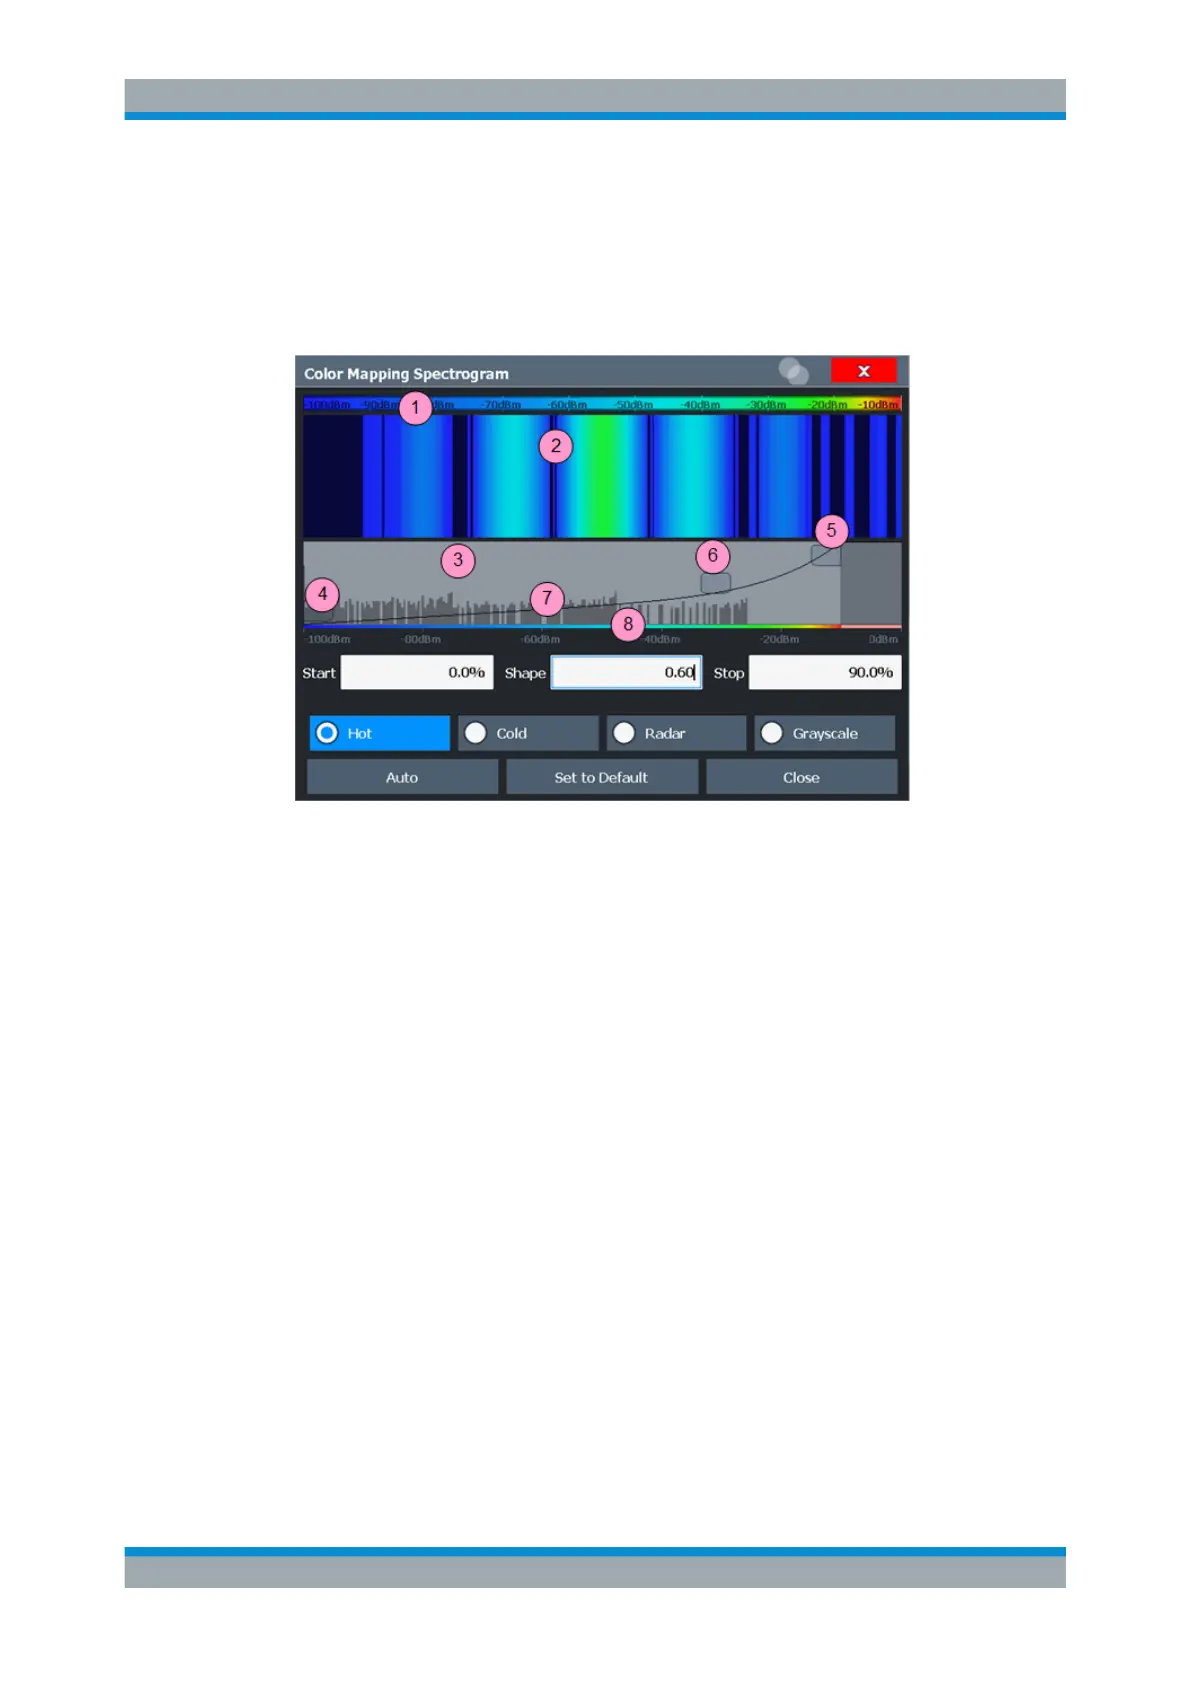
In addition to the available color settings, the dialog box displays the current color map
and provides a preview of the display with the current settings.
Figure 9-18: Color Mapping dialog box
1 = Color map: shows the current color distribution
2 = Preview pane: shows a preview of the spectrogram with any changes that you make to the color
scheme
3 = Color curve pane: graphical representation of all settings available to customize the color scheme
4/5 = Color range start and stop sliders: define the range of the color map or amplitudes for the spectrogram
6 = Color curve slider: adjusts the focus of the color curve
7 = Histogram: shows the distribution of measured values
8 = Scale of the horizontal axis (value range)
Start / Stop ..................................................................................................................511
Shape ......................................................................................................................... 511
Hot / Cold / Radar / Grayscale ................................................................................... 512
Auto ............................................................................................................................512
Set to Default ............................................................................................................. 512
Close...........................................................................................................................512
Start / Stop
Defines the lower and upper boundaries of the value range of the spectrogram.
Remote command:
DISPlay[:WINDow<n>]:SPECtrogram:COLor:LOWer on page 971
DISPlay[:WINDow<n>]:SPECtrogram:COLor:UPPer on page 971
Shape
Defines the shape and focus of the color curve for the spectrogram result display.
"-1 to <0"
More colors are distributed among the lower values
Trace Configuration

 Loading...


