Calibration
OmniTrax Product Guide Page 201
Selecting the ideal point to trim the profile would seem to be an easy choice (optimal signal level).
However, there is another critical factor that must be considered. The Profile MUST NOT be
trimmed to a point which results in either a low spot (with weak detection) or a dead spot (with no
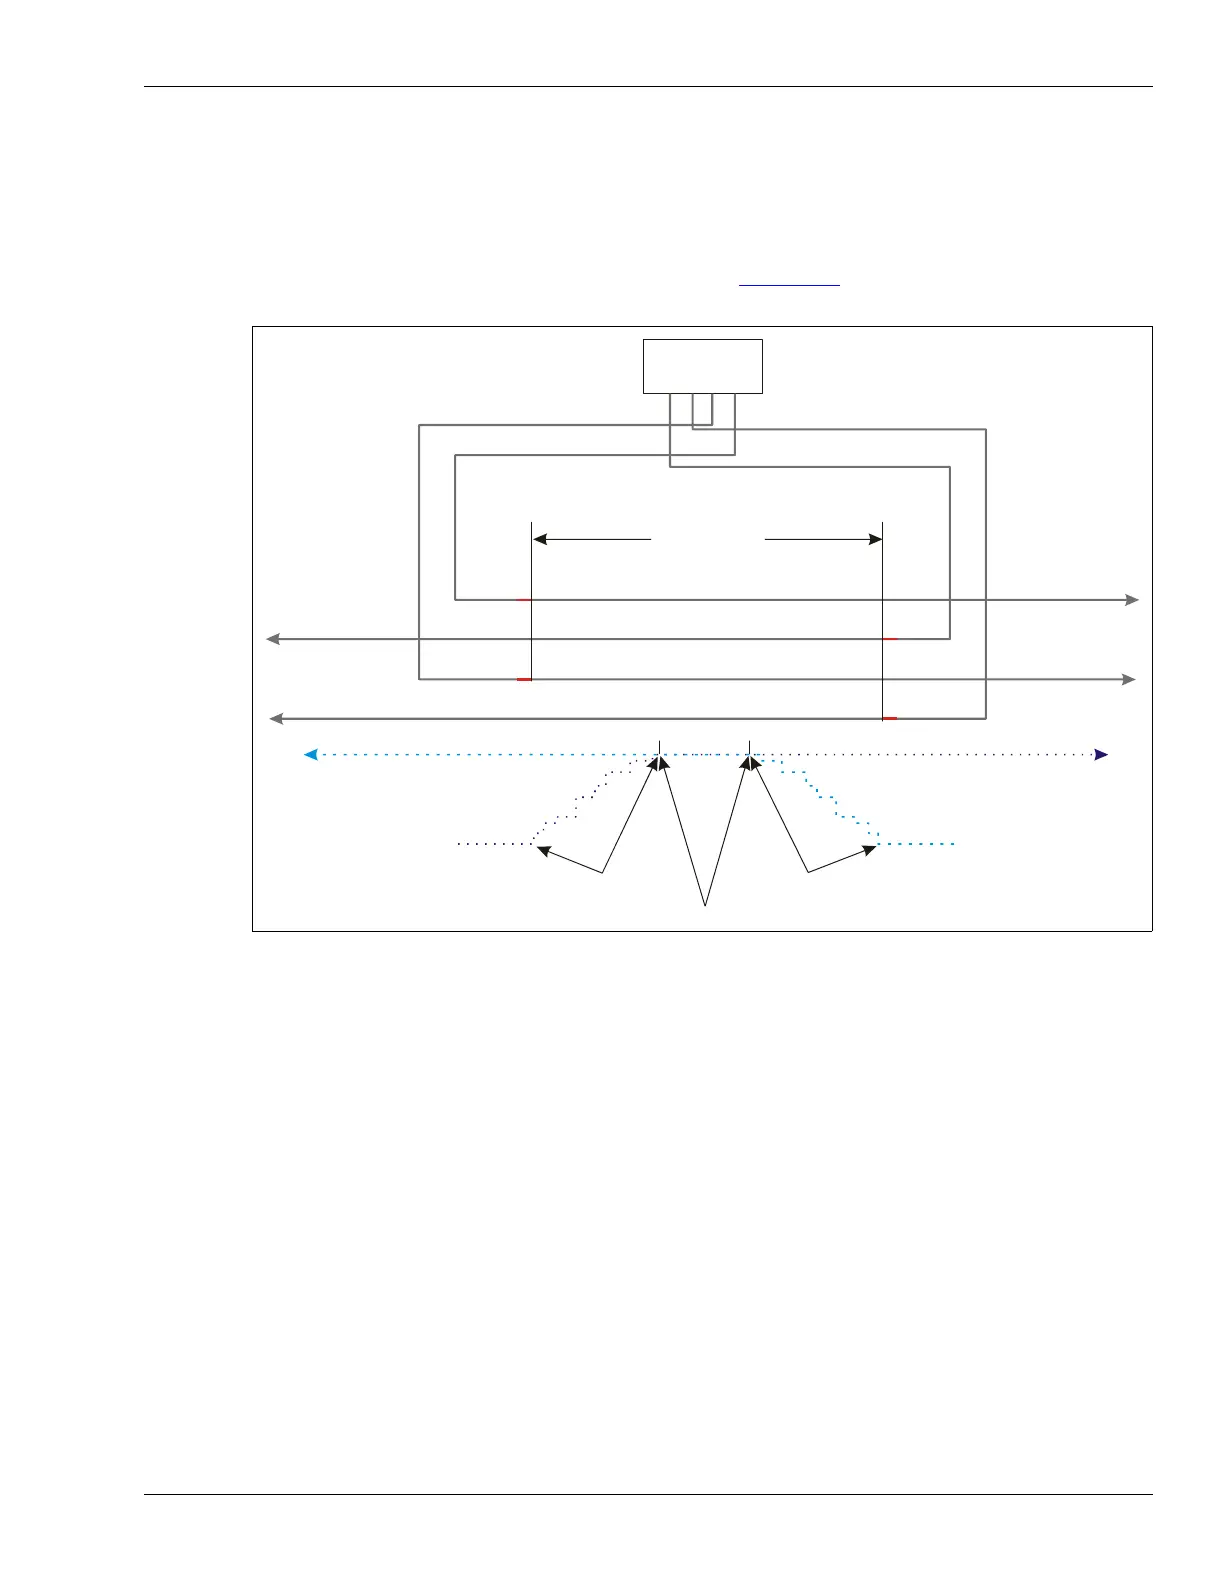
detection) in an area where detection is required. The 8 m overlap between the red bands at the
start point provides enough room for both detection signals (A-side and B-side) to reach optimum
levels. You must determine the location where both detection signals are at full strength, and trim
out the sections in which the fields are building up. Figure 179:
illustrates the detection field build
up concept and indicates the overlap where full detection exists on both cable sides.
Locating the exact point on the sensor cables where an adequate detection signal begins presents
some additional challenges. Ideally, the location of the red bands, where the detection signal
begins is clearly marked. In this case, you make perpendicular crossings at one meter intervals,
beginning at the red bands and moving toward the detection zone (the test subject should be the
same person who did the centerline cable walk). While making the crossings, record an OmniTrax
response plot on the UCM. You then review the recorded response plot to determine a safe
location for profile editing.
1. Set up the response plot for Side A, with Magnitude vs Location, Absolute, and Peak capture
selected. Expand both the vertical and horizontal magnifications to 4X.
2. Select the Record button to begin recording the response plot.
3. Have the test subject make the first crossing at the location of the A-side cables red bands
(start point of detecting cable).
4. The test subject then moves one meter down the cable, marks the location and make a
second perpendicular crossing.
5. The test subject continues making crossings at one meter intervals until the first 5 m of
detecting cable are covered (6 crossings total).
Figure 179: Detection field overlap
processor
8 m (26 ft.)
overlap
A-side
B-side
full strength signal
full strength signal
usable signal
usable signal
low signal
low signal
A-side field build up
no signal
no signal
B-side field build up
B-side trim out A-side trim out
full strength signal overlap