Sysmex XP-300 8-1
Display and Output of Analysis Results
Revised April 2012
8. Display and Output of Analysis Results
After each analysis the results are displayed on the LCD screen. The
analysis result screen is composed of 4 LCD screen pages. The
histogram, volume distribution flag, abnormal data flag, analysis
error flag, and analysis values are displayed.
This instrument can store analysis results in memory and display
them on the screen.
The analysis results can be printed from the internal/external printer
or output to the host computer.
8.1 Latest sample (analysis result screen)
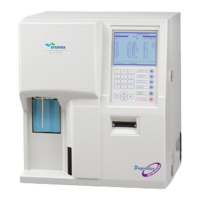
Analysis results of the latest sample are displayed on the LCD analysis result screen after the analysis is
completed. Pressing the [Result] button on the Main screen also displays the analysis result screen.
The analysis result screen is composed of the first to fourth screens. Each screen can be switched by pressing
the [←] or [→] button and displayed in the order as shown in the diagram below.
Data stored in memory includes QC analysis results.
Second analysis result screenFirst analysis result screen
Third analysis result screenFourth analysis result screen