www.trilithic.com
Page IV-37
180 DSP Operation Manual
Signal Level Meter
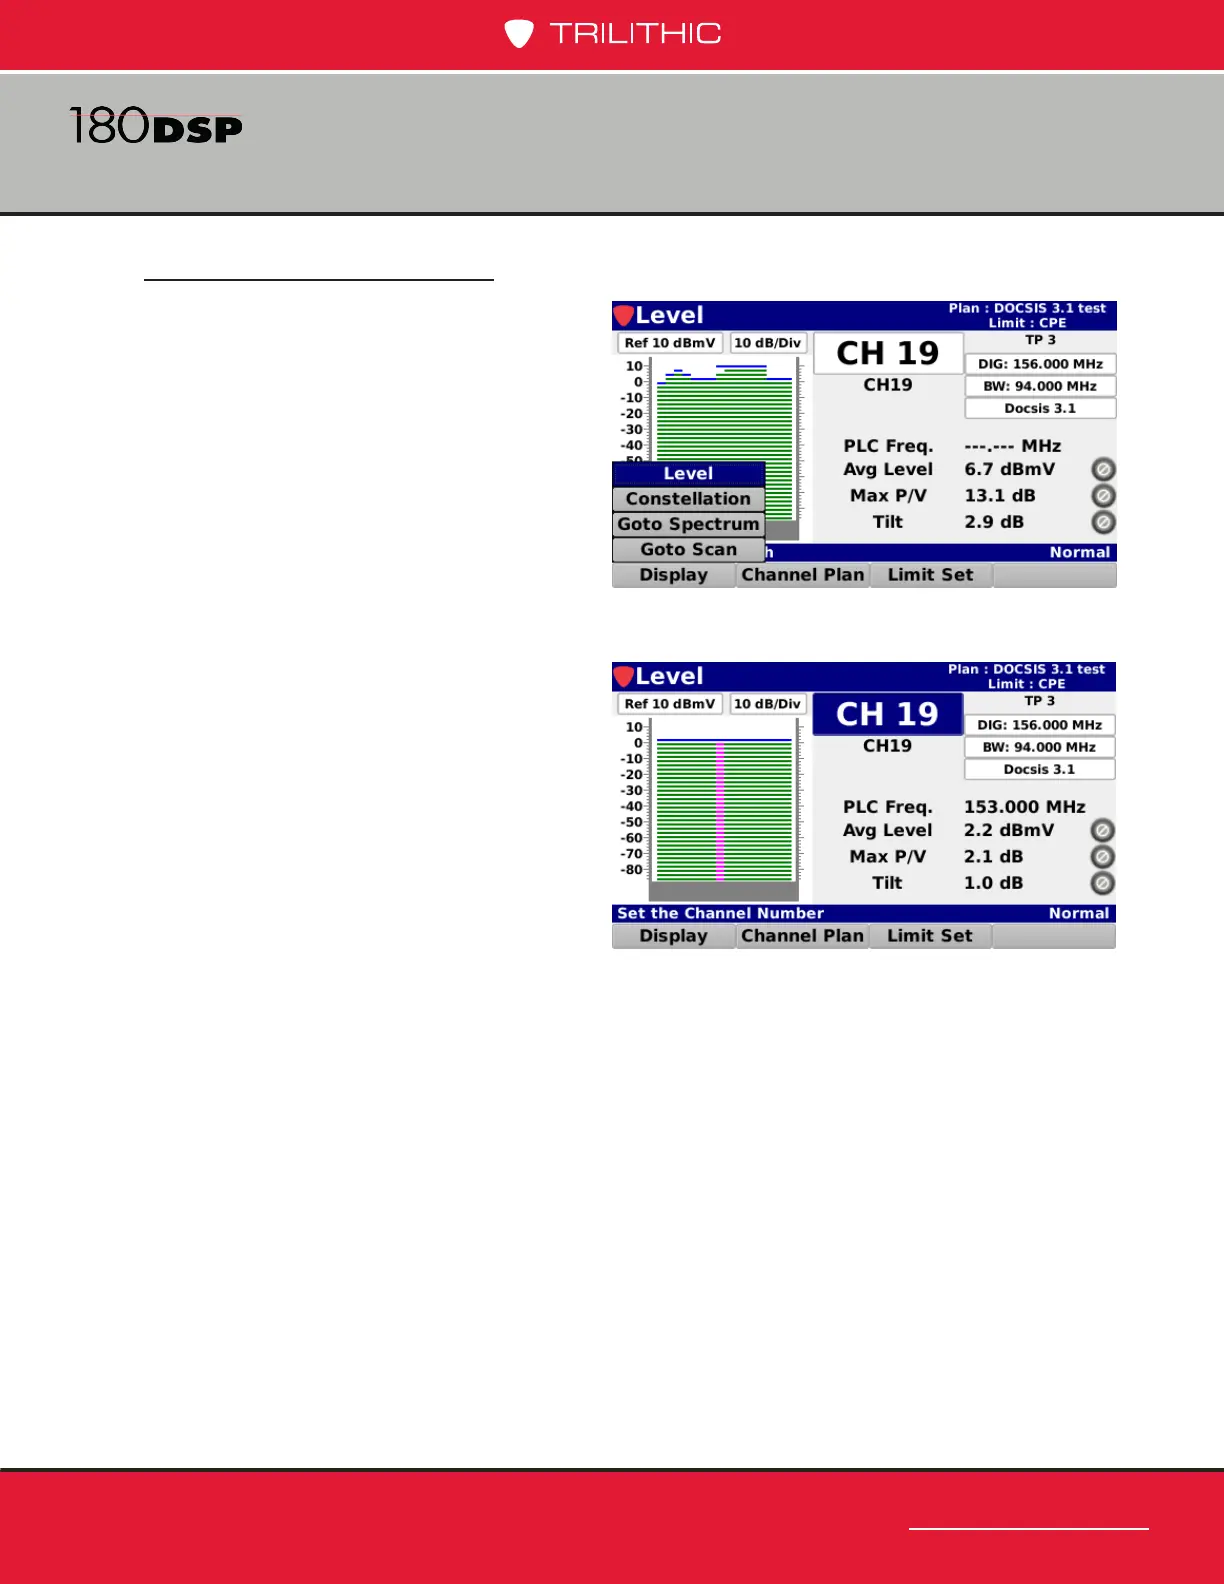
Bar Graph
Select the Level button from the
Display pop-up menu to display a bar
graph of the digital video carrier
The following measurement results
are displayed with a pass/fail status for
each measurement that is included in
the open limit set:
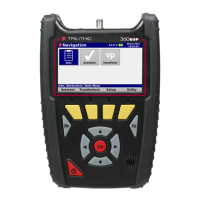
• Physical link channel (PLC)
frequency with bar graph
The PLC is a set of contiguous
OFDM subcarriers (eight for 4K FFT and 16 for 8K FFT), constituting a “sub-
channel” of the OFDM channel, which conveys physical layer parameters from
the CMTS to the cable modem. It is represented by the pink vertical bar in the
middle of the bar graph above.
• Average channel level value
• Max peak to valley
• Tilt
Display Type Adjustment
Select the Display softkey to scroll
through the following types of
measurement displays: