9500 MXC User Manual
3DB 23063 ADAA - Rev 004 July 2007 Vol. IV-15-9
Event Browser Screen Description
The screen opens to an event listing, which scrolls down to the latest event,
unless auto-scroll is turned off. Other lists (boxes) can be enabled using tabs on
the lower right.
Event box provides a date/time-stamped listing for each new event (alarm and
informational). Events are shown in true chronological order with time-stamping
to a 0.1 second resolution. Indicators assist with identification of event source
(plug-in location), whether it is a new or cleared event, and the severity and
status of the event.
All Occurrences box is user-selected by clicking the ‘Show Occurrences’ tab. It
provides an automatic listing for all like events selected (highlighted) in the
Event box. For instance, if an SESR line is selected in the Event box, then the All
Occurrences box is populated only with SESR events and in the same time and
date order as in the Event box. It is particularly useful in matching and viewing
the history of one event type, and when coupled with the plug-in location
graphic, also by plug-in.
Description box is user-selected by clicking the ‘Show Description’ tab. It
currently only replicates event-line data.
Event Browser Navigation
The INU graphic shows which card in an INU has raised the listed event.
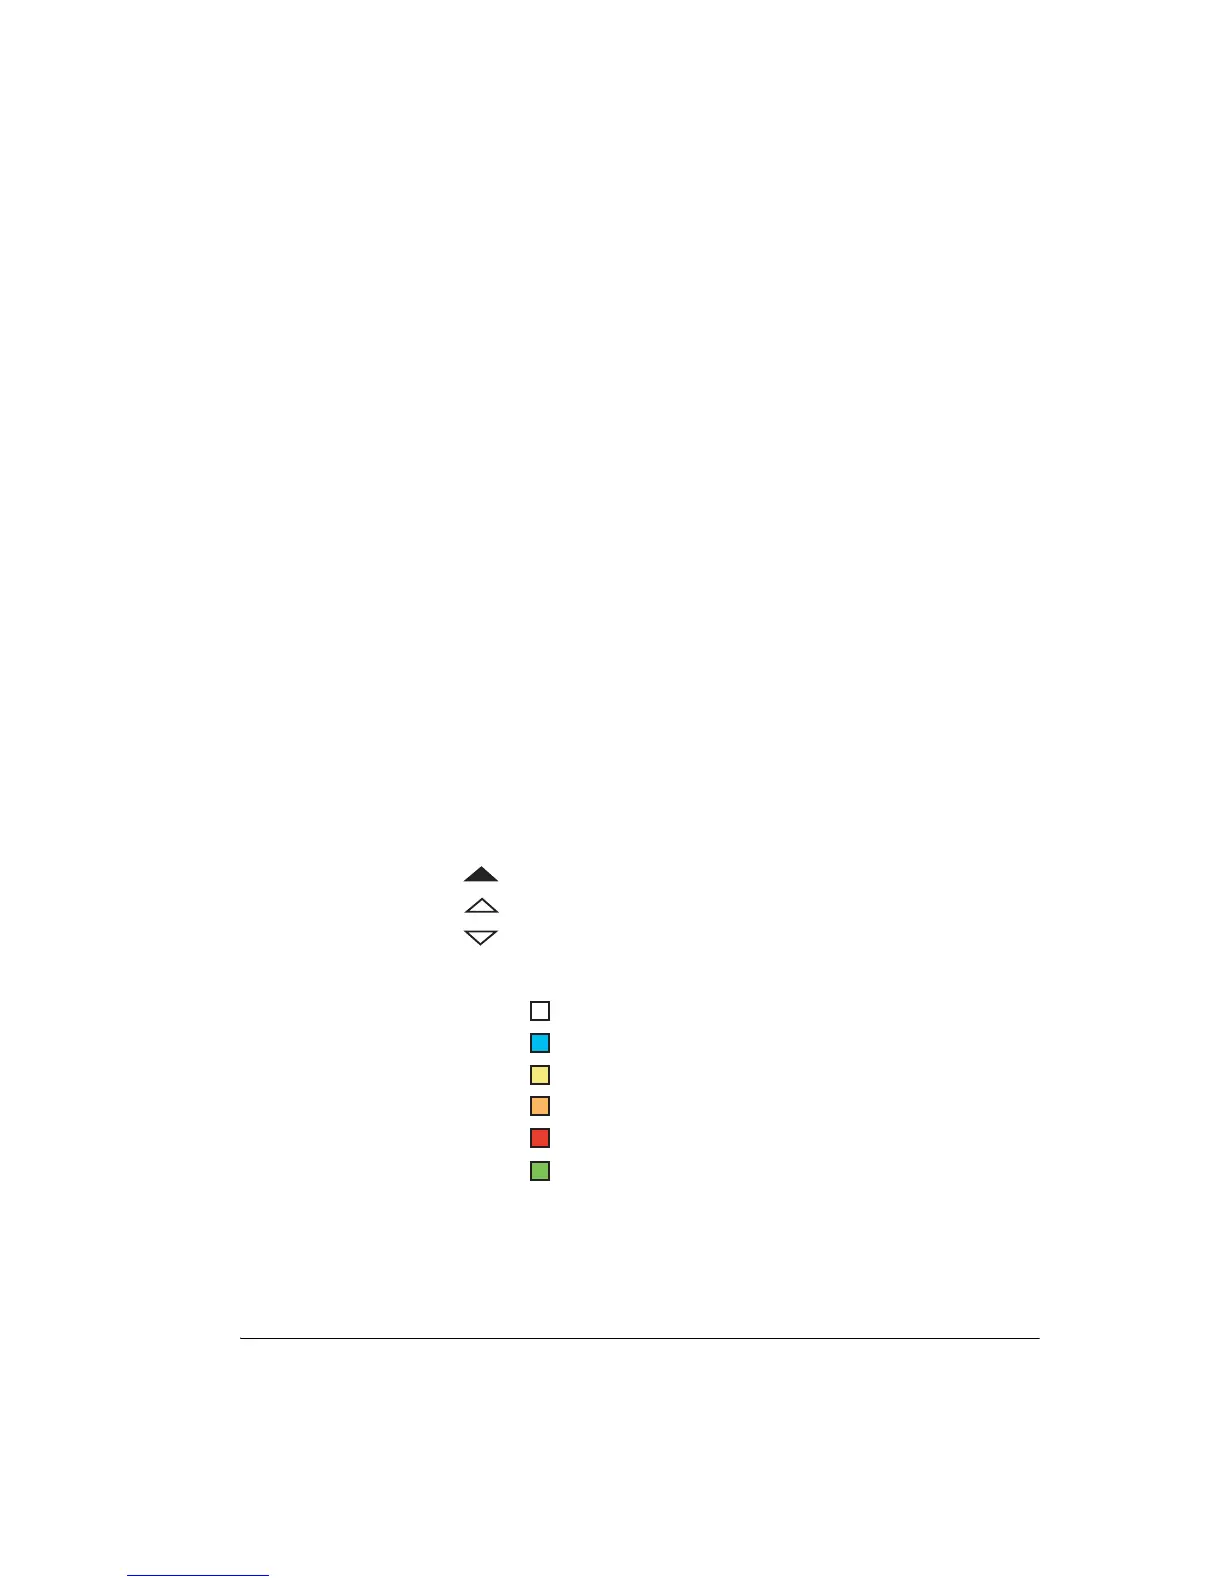
Triangles indicate one of three event status types:
Colors indicate event type/severity:
Date/Time Setting
The default setting has latest events listed at the bottom. To put the latest event at
the top, click on Date/Time to reverse the date/time triangle.
Event was raised
Event was cleared
Event active
Informational
Warning
Minor
Major
Critical
Cleared
White
Cyan
Yellow
Orange
Red
Green