26 ST80 Masterview Operation and Setup
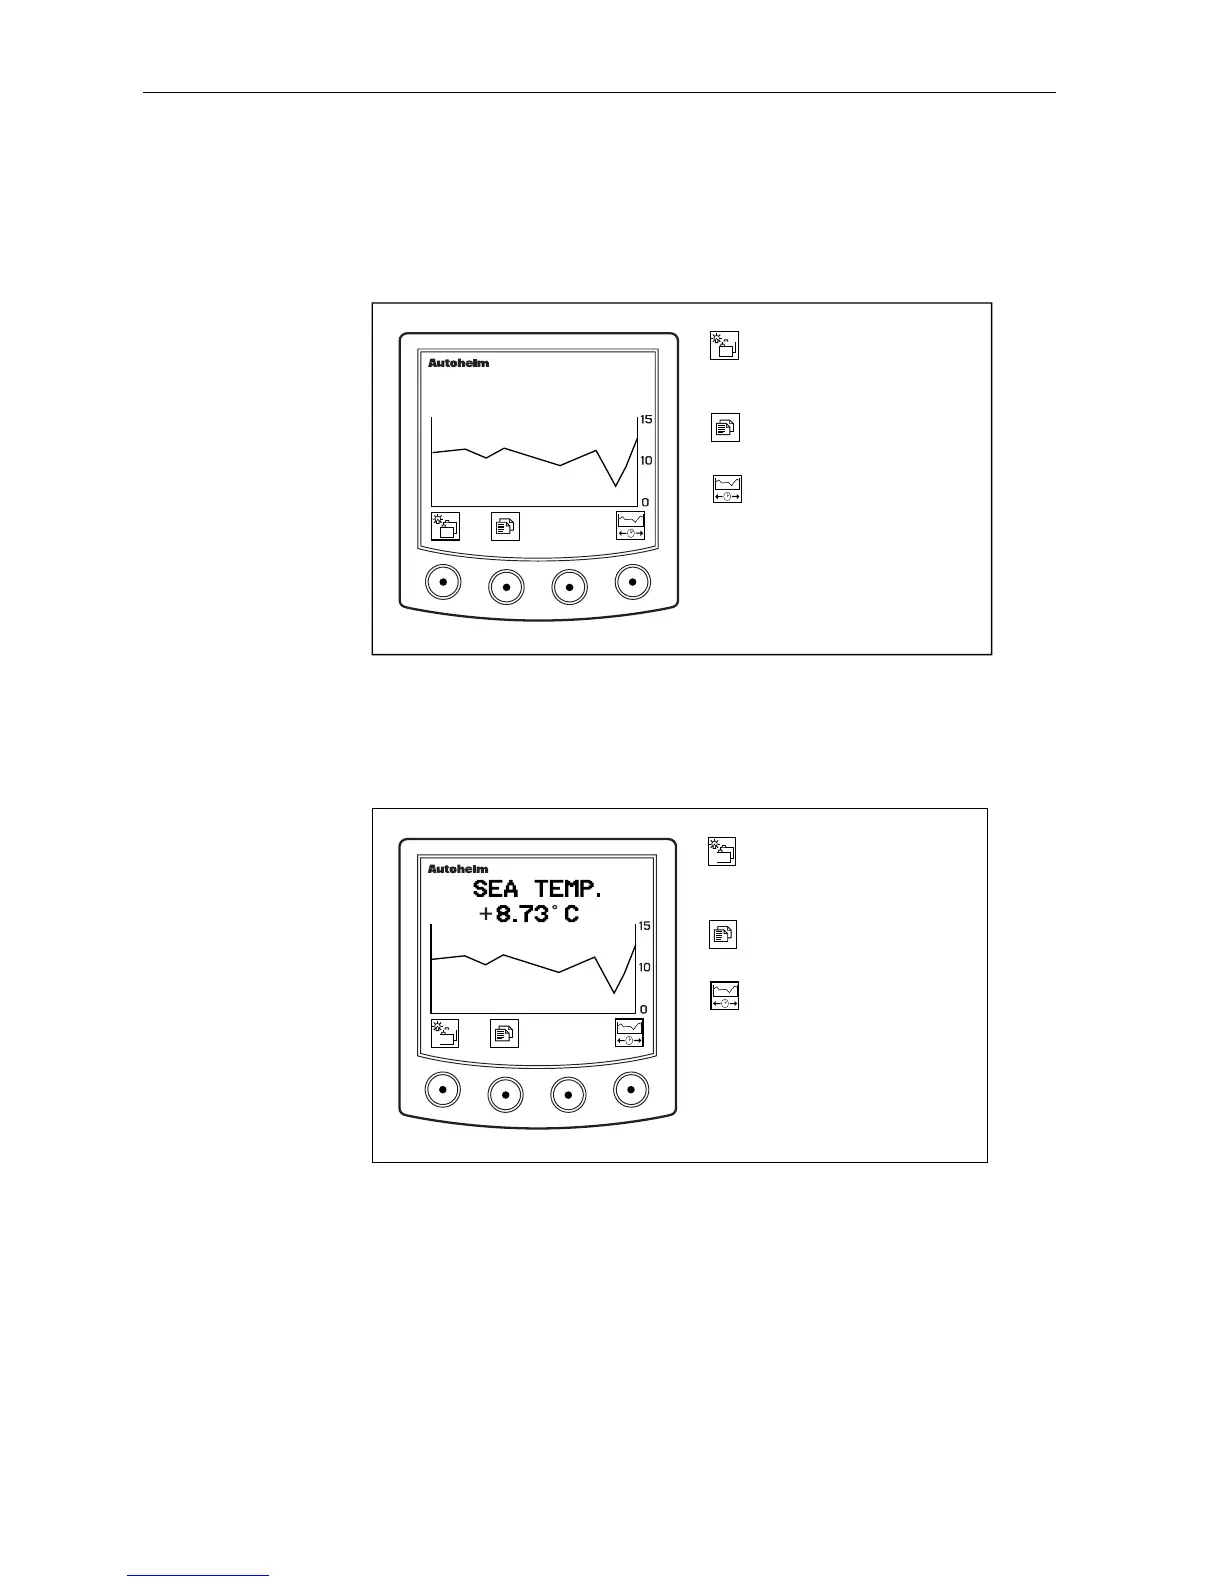
Speed Histogram
The histogram displays a graph of your boat speed for a selected
period of time. The following illustration shows a typical example
of a speed histogram.
D2234-1
Go to the next chapter.
Press for 1 second to enter
illumination adjustment.
Go to next page. Press for 1
second for previous page.
Select time scale for
histogram 1 and 10min, 1hr,
6hr, 24hr.
masterview
1HR
SPEED
8.73 KTS
Sea Temperature
This page displays the current sea temperature as well as a graph
depicting the sea temperature for a selected period of time.
D4137-1
Go to the next chapter.
Press for 1 second to enter
illumination adjustment.
Go to next page. Press for 1
second for previous page.
Select time scale for
histogram 1 and 10min, 1hr,
6hr, 24hr.
masterview
1HR