6-24 824 Reference Manual 11/8/00
Overall
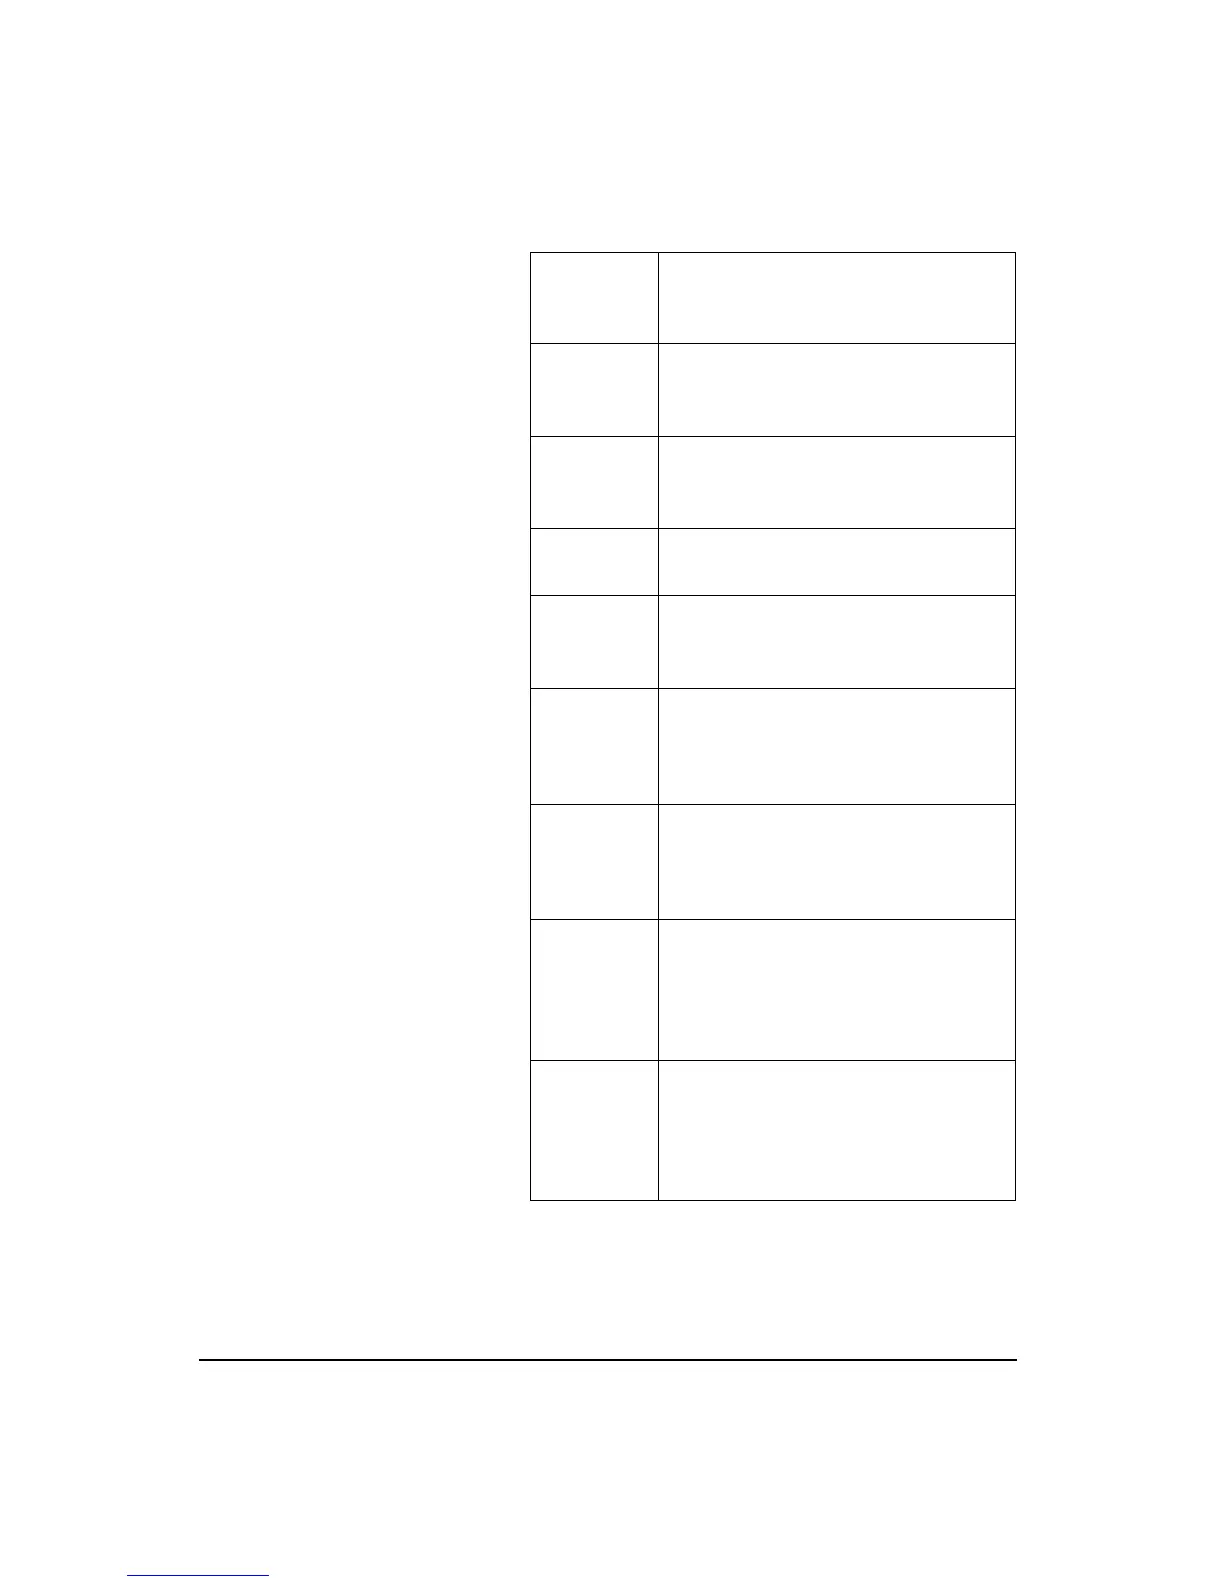
SLM
An accumulation of data over the entire
measurement period and is reset when the
entire measurement is reset.
Exposure The Exposure displays show dose and
projected dose, the sound exposure (E)
and C-A.
Ln Centiles Display shows six selected L
n
values, a
graph of L
1
to L
99
and a graph of the per-
cent greater than level.
Stats The number of overloads and the number
of events detected.
Run Log A listing of each run, stop, pause, con-
tinue, and mark action with its cause, and
date/time of occurrence.
Time
History
Show the time history of L
eq
and option-
ally many other levels such as L
max
, L
pk
or Advanced TH setup items over short
duration periods.
Intervals Shows a full statistical history over a
longer time period by providing TWA,
SEL, L
min
, L
max
, L
pk-I
, L
pk-II
, and six L
n
values for each interval period.
Excd
History
A special history which is saved when the
level goes over a predetermined thresh-
old. Leq, SEL, Lmax, LPK-I, LPK-II,
duration and time history ( if desired) are
saved for each exceedance record.
Daily
History
Ldn, CNEL, Leq 24, LPK-I, LPK-II, Ln’s
(if desired), Lmax and Lmin are calcu-
lated daily; and for each hour of the day
the hourly Leq, EXCD Leq and back-
ground Leq.