Histogram Theory of Operation
An understanding of statistical variations in parameter values is needed for many waveform
parameter measurements. Knowledge of the average, minimum, maximum, and standard
deviation of the parameter are often enough. However, in many cases you may need a more
detailed understanding of the distribution of a parameter's values.
Histograms allow you to see how a parameter's values are distributed over many measurements.
This is done by dividing a range of parameter values into sub-ranges called bins. A count of the
number of parameter values (events) falling within ranges of the bin itself is maintained for each
bin.
While such a value range can be infinite, for practical purposes it only needs to be defined as
large enough to include any realistically possible parameter value. For example, measuring TTL
high-voltage values in a range of ±50 V is unnecessarily large, while one of 4 V ±2.5 V is more
reasonable. It is the 5 V range that is subdivided into bins. If the number of bins used were 50,
each would have a range of 5 V/50 bins or 0.1 V/bin. Events falling into the first bin would be
between 1.5 V and 1.6 V, while the next bin would capture all events between 1.6 V and 1.7 V,
and so on.
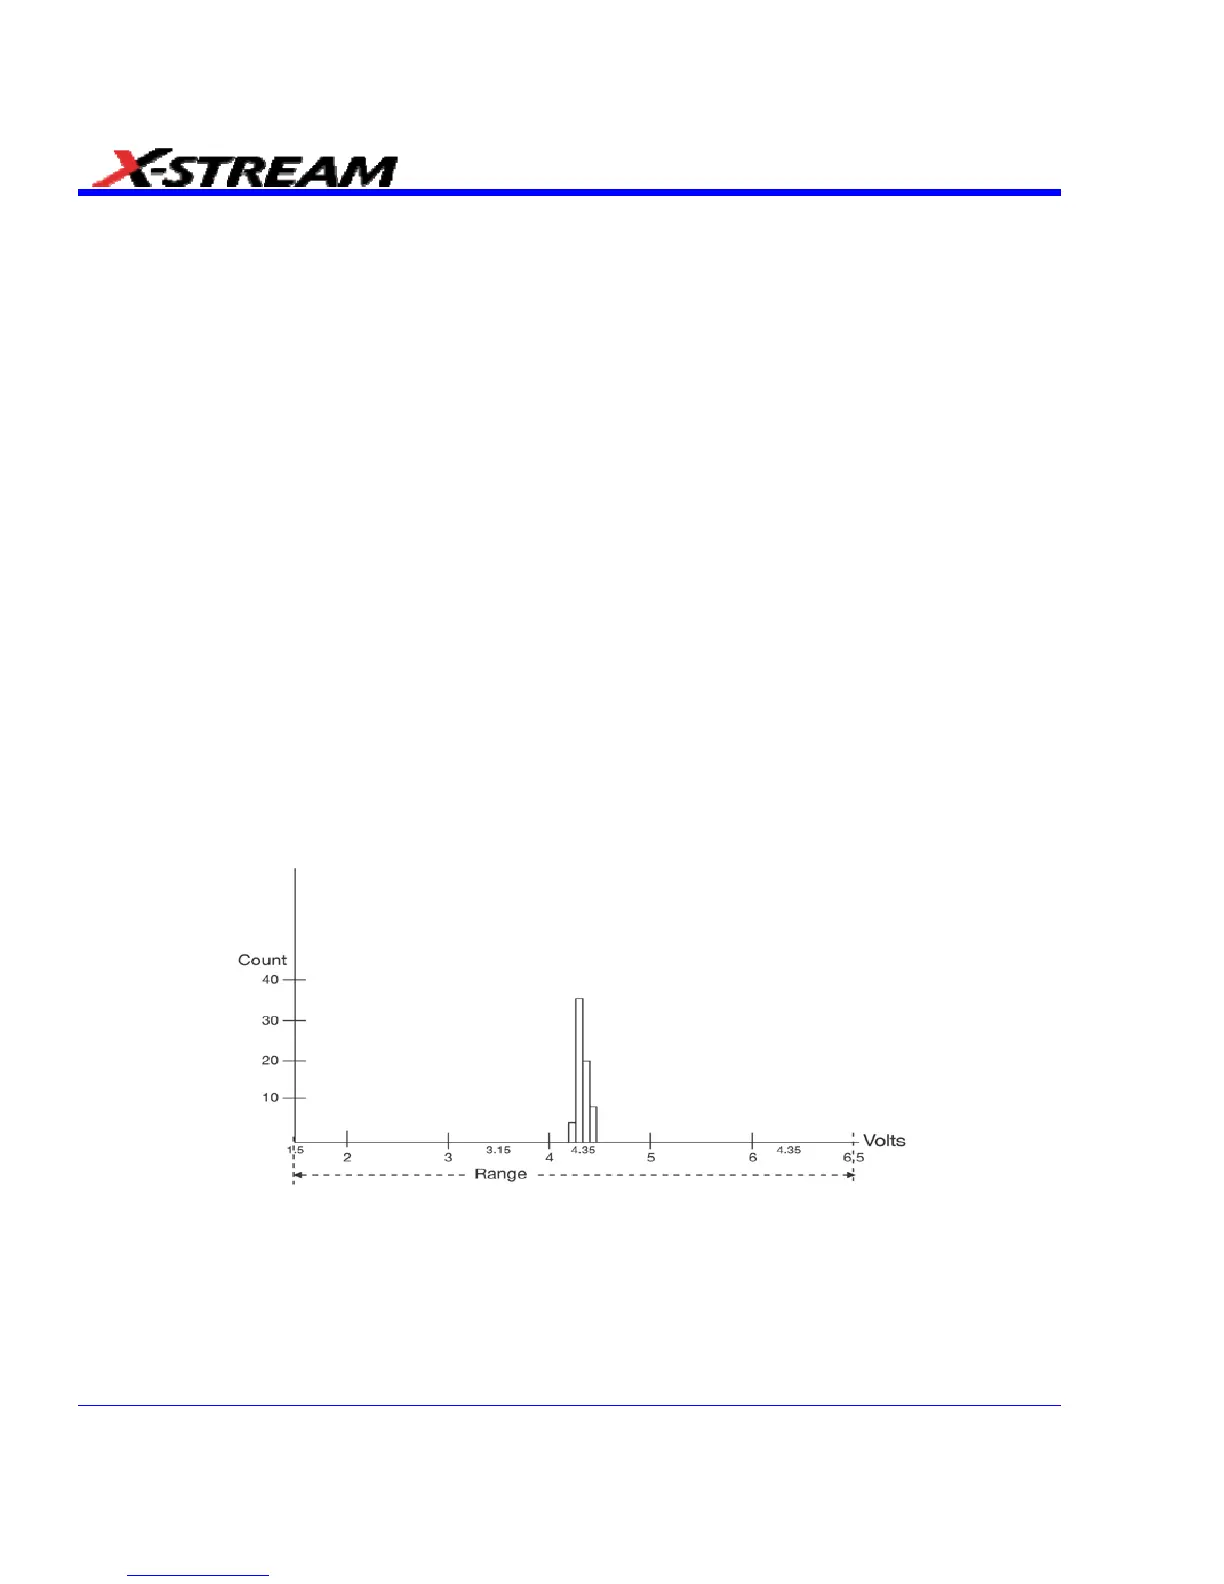
After a process of several thousand events, the bar graph of the count for each bin (its histogram)
provides a good understanding of the distribution of values. Histograms generally use the 'x' axis
to show a bin's sub-range value and the 'Y' axis for the count of parameter values within each bin.
The leftmost bin with a non-zero count shows the lowest parameter value measurements. The
highest vertical bin shows the greatest number of events falling within its sub-range.
The number of events in a bin, peak or a histogram is referred to as its population. The following
figure shows a histogram's highest population bin as the one with a sub-range of 4.3 to 4.4 V
(which is expected from a TTL signal).
The lowest-value bin with events is that with a sub-range of 3.0 to 3.1 V. As TTL high voltages
need to be greater than 2.5 V, the lowest bin is within the allowable tolerance. However, because
of its proximity to this tolerance and the degree of the bin's separation from all other values,
additional investigation may be required.
132 SDA-OM-E Rev H