Eye Pattern
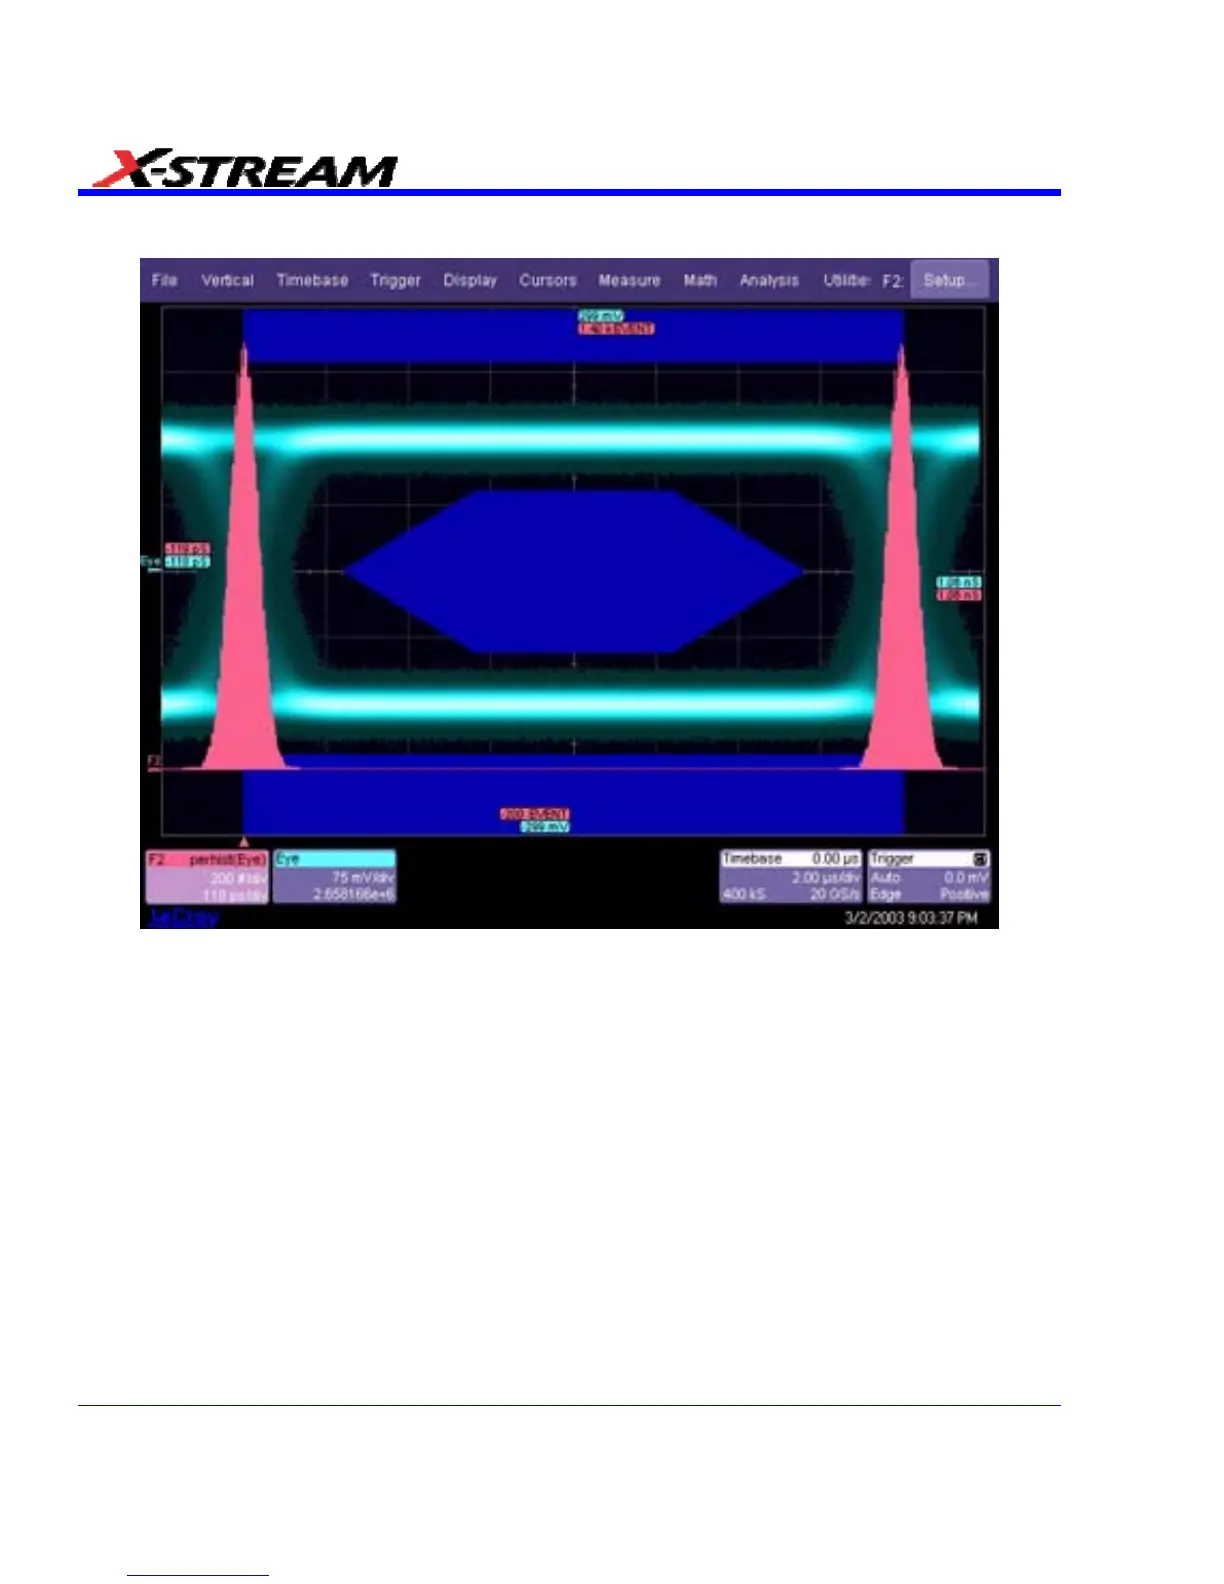
Figure 3. Histogram of Zero Crossing in Eye Pattern Showing Jitter Distribution
An eye diagram shows all values a digital signal takes on during a bit period. A bit period (or UI)
is defined by the data clock, so some sort of data clock is needed to measure the eye pattern.
The traditional method of generating an eye pattern involves acquiring data on an oscilloscope
and using the data clock as a trigger. One or more samples are taken on each trigger. The
samples are stored in a persistence map with the vertical dimension equal to the signal level, and
the horizontal position equal to the sample position relative to the trigger (or data clock). As many
data points are collected, the eye pattern fills in with multiple occurrences of time and amplitude
values counted by incrementing counters in each x,y “bin.” Timing jitter is indicated by the
horizontal distribution of the points around the data crossings. The histogram of the bins around
the crossing points provides the distribution of jitter amplitude.
A recovered clock is used if there is no access to a data clock. The recovered clock is normally a
hardware PLL designed to operate at specific data rates and with a cutoff frequency of Fd/1667.
One of the major drawbacks of a hardware clock recovery circuit is that jitter associated with the
trigger circuit adds to the measured jitter by creating uncertainty in the horizontal positioning of
the eye pattern samples.
368 SDA-OM-E Rev H