Bathtub Curve
The bathtub curve is the integral of the jitter probability density function (PDF – derived by
normalizing the extrapolated TIE histogram - see the Theory section) for all possible sampling
points within one unit interval (UI). The right side of the bathtub curve is the integral of the jitter
pdf from approximately -1/2 of a UI to zero and the left side is the integral from +1/2 of a UI to
zero, where the jitter PDF is centered about zero, and zero is defined as the ideal crossing time of
a bit. The bathtub curve is normalized to 1 UI. It is a logarithmic representation of bit error rate
(BER) vs. the sampling point. The greater the degree of separation between the sides of the
bathtub curve, the better the BER.
The horizontal distance between the sides of the bathtub curve at a given Y value (bit error rate)
is a measure of the eye width at that bit error rate.
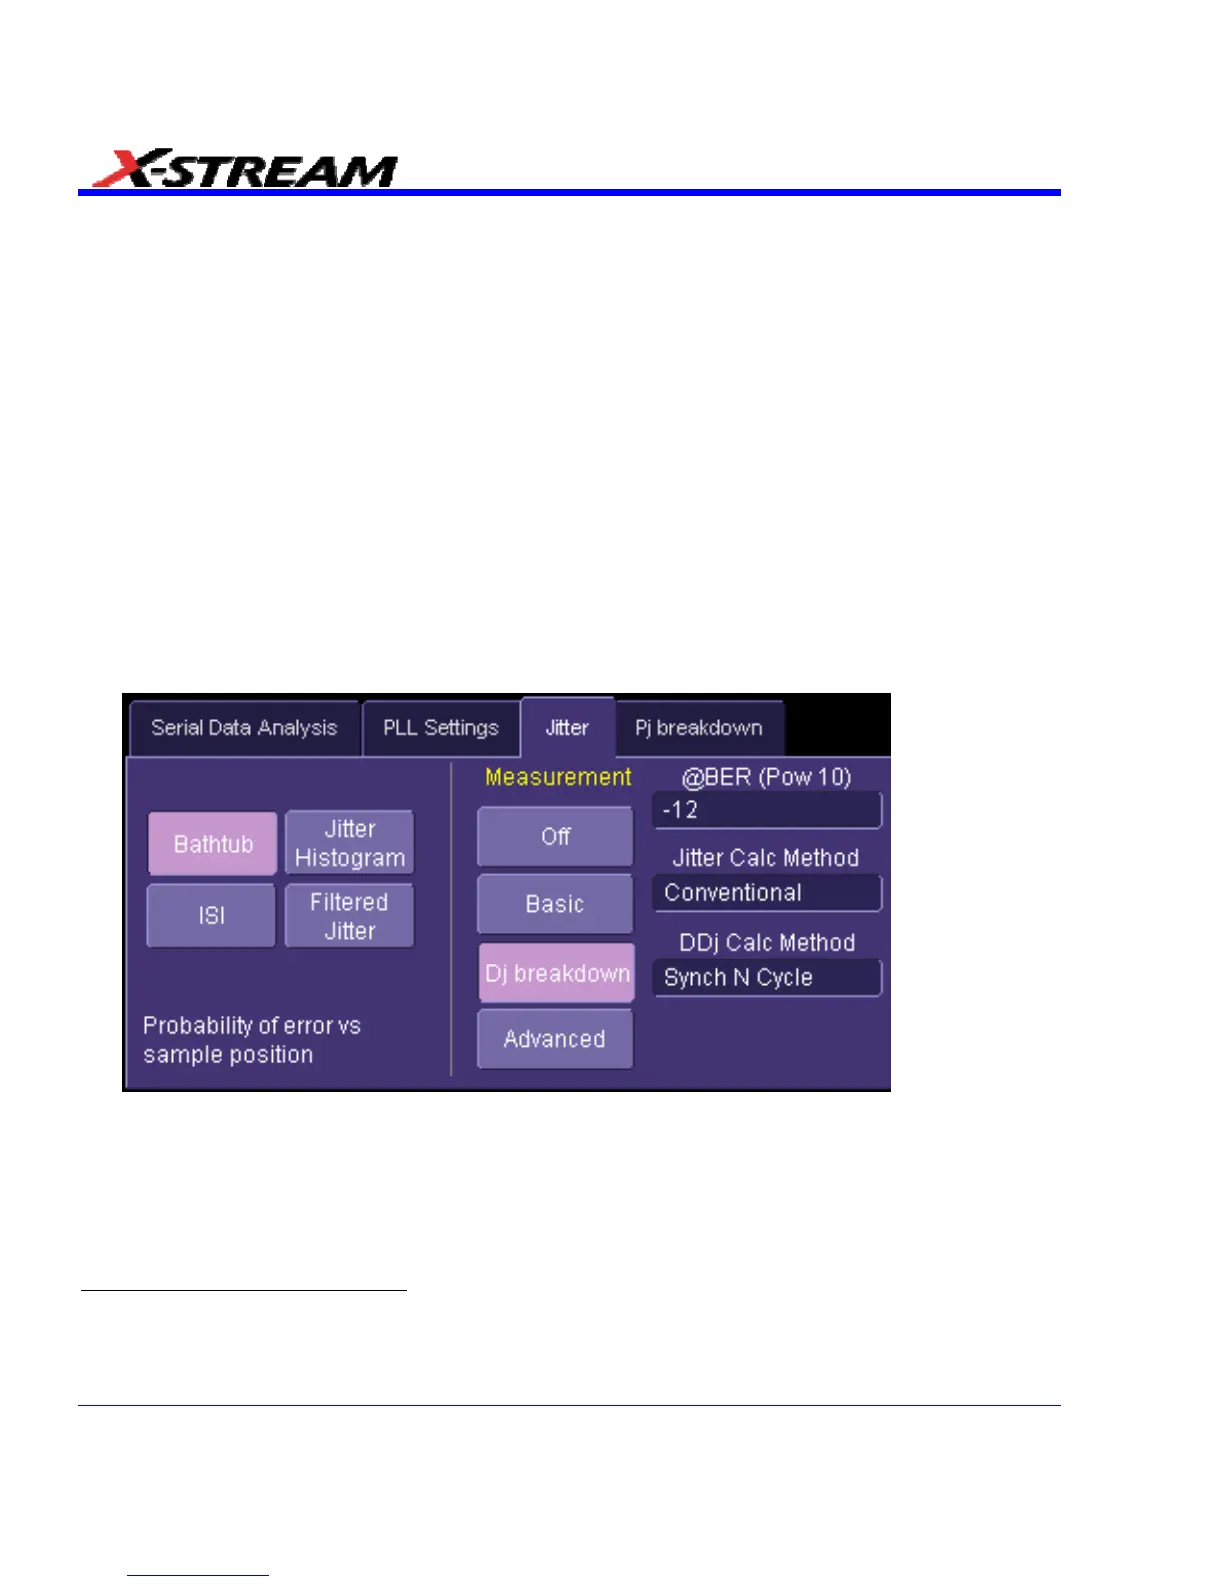
1. Press the SDA front panel button; or, touch Analysis in the menu bar, then Serial Data in the
drop-down menu. The display defaults to the "Scope" dialog, which enables you to set up
SDA measurements while you continue to view currently displayed waveforms.
2. Touch the Jitter button. The Jitter Bathtub setup dialog is displayed. You can enable
several parameter measurements from this dialog:
3. For basic measurements, touch the Basic button, then touch inside the @BER(Pow 10)
9
field. Enter an exponent value, using the pop-up keypad.
336 SDA-OM-E Rev H
9
The bit error rate (BER) is the percentage of bits that have errors relative to the total number of bits received in a
transmission. Thus, a BER of 10
-6
means that out of 1,000,000 bits transmitted, one bit was in error. The BER is an
indication of how often a packet of data must be retransmitted because of error. The setting of the @BER control affects
the indicated jitter values by selecting the vertical level at which the width of the total jitter (integrated TIE histogram) is
measured. In general the Tj value will increase with decreasing bit error rate (more negative power of ten).