SDA Operator’s Manual
Second Example PlugIn: Log-Log FFT Plot
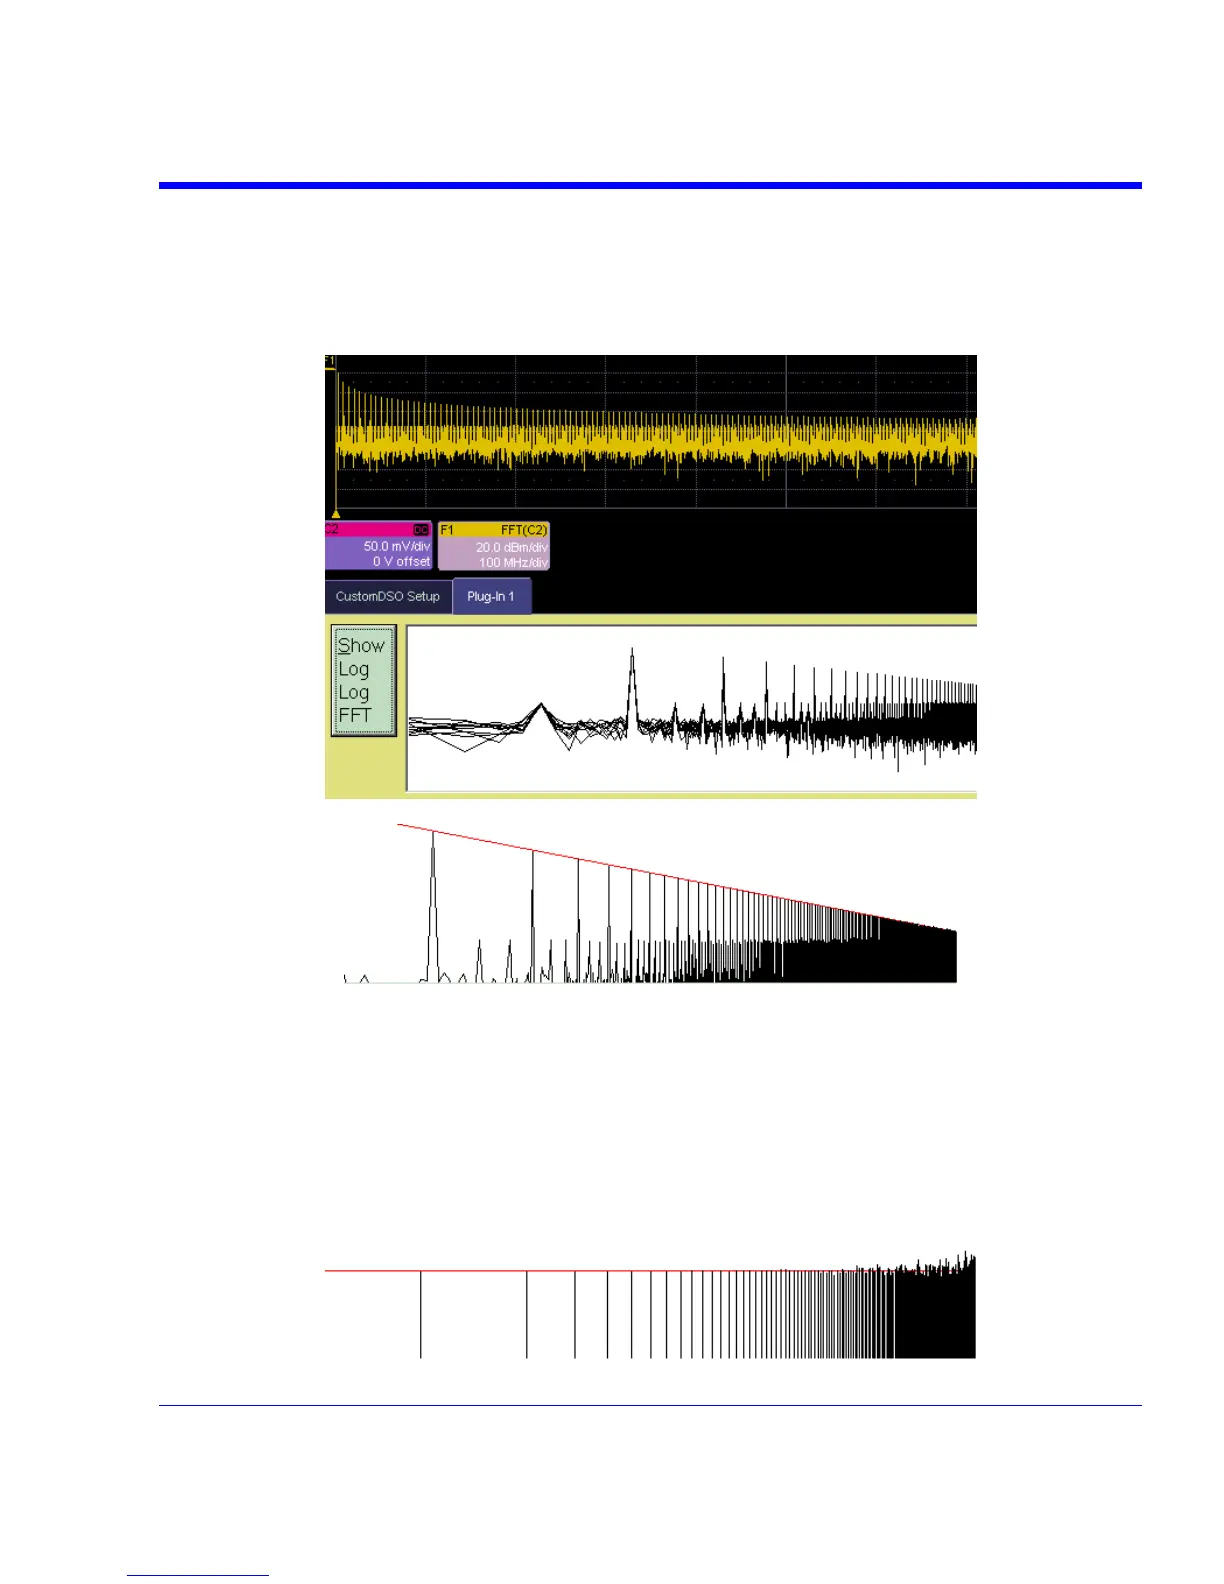
A frequent requirement is to plot a frequency spectrum on two logarithmic scales. The instrument
provides a vertical scale, so CustomDSO has only to change the horizontal one. Here is an
example. The first figure has been truncated on the right side.
These examples were made with two different instrument setups: in the second, the FFT was
zoomed vertically. The graph has a red line to represent the theoretical envelope for the peaks.
This has great potential for testing the transmission characteristics of amplifiers and filters, since
the output can be compared with a theoretical curve. Furthermore, if the output is divided by the
curve, the result for a perfect DUT would be a horizontal line, which is easy to inspect. The
example below has been magnified vertically by a factor of ten. The rise at the right side occurs
because the signal is descending into the noise.
SDA-OM-E Rev H 291