Htie to BER
This function takes as an input a histogram and converts it to one of 6 output waveforms.
Normally, the histogram contains a set of time interval error (TIE) measurements from which a
total jitter measurement is desired. The histogram should have a population of at least 100k and a
minimum of 500 bins. The histogram should also be completely contained on the instrument
screen (it may be necessary to set the horizontal scale to do this). The table below outlines the
settings for this function.
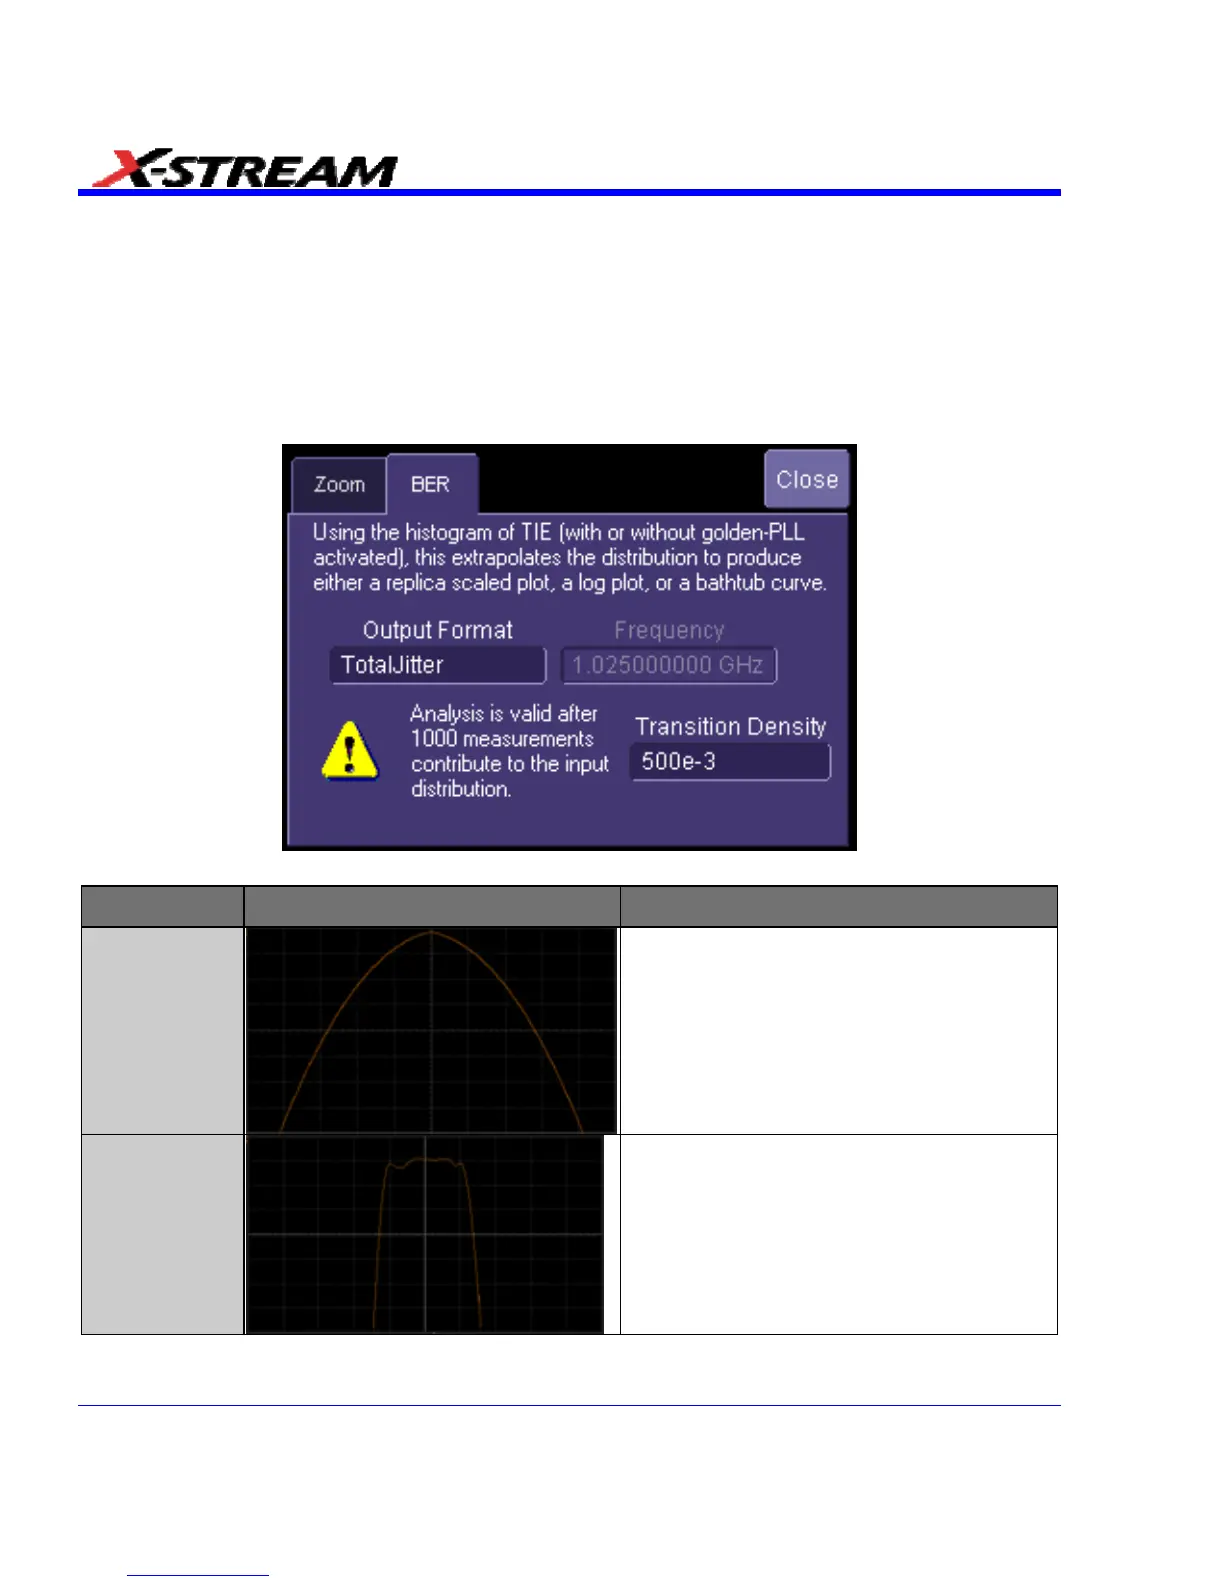
Output Format
Waveform Type
TjGaussian The total jitter curve for a Gaussian with
zero mean and unity standard deviation
LogEstTIE The log of the estimated (extrapolated)
time interval error histogram
350 SDA-OM-E Rev H