SDA Operator’s Manual
SDA-OM-E Rev H 351
Control Values Description
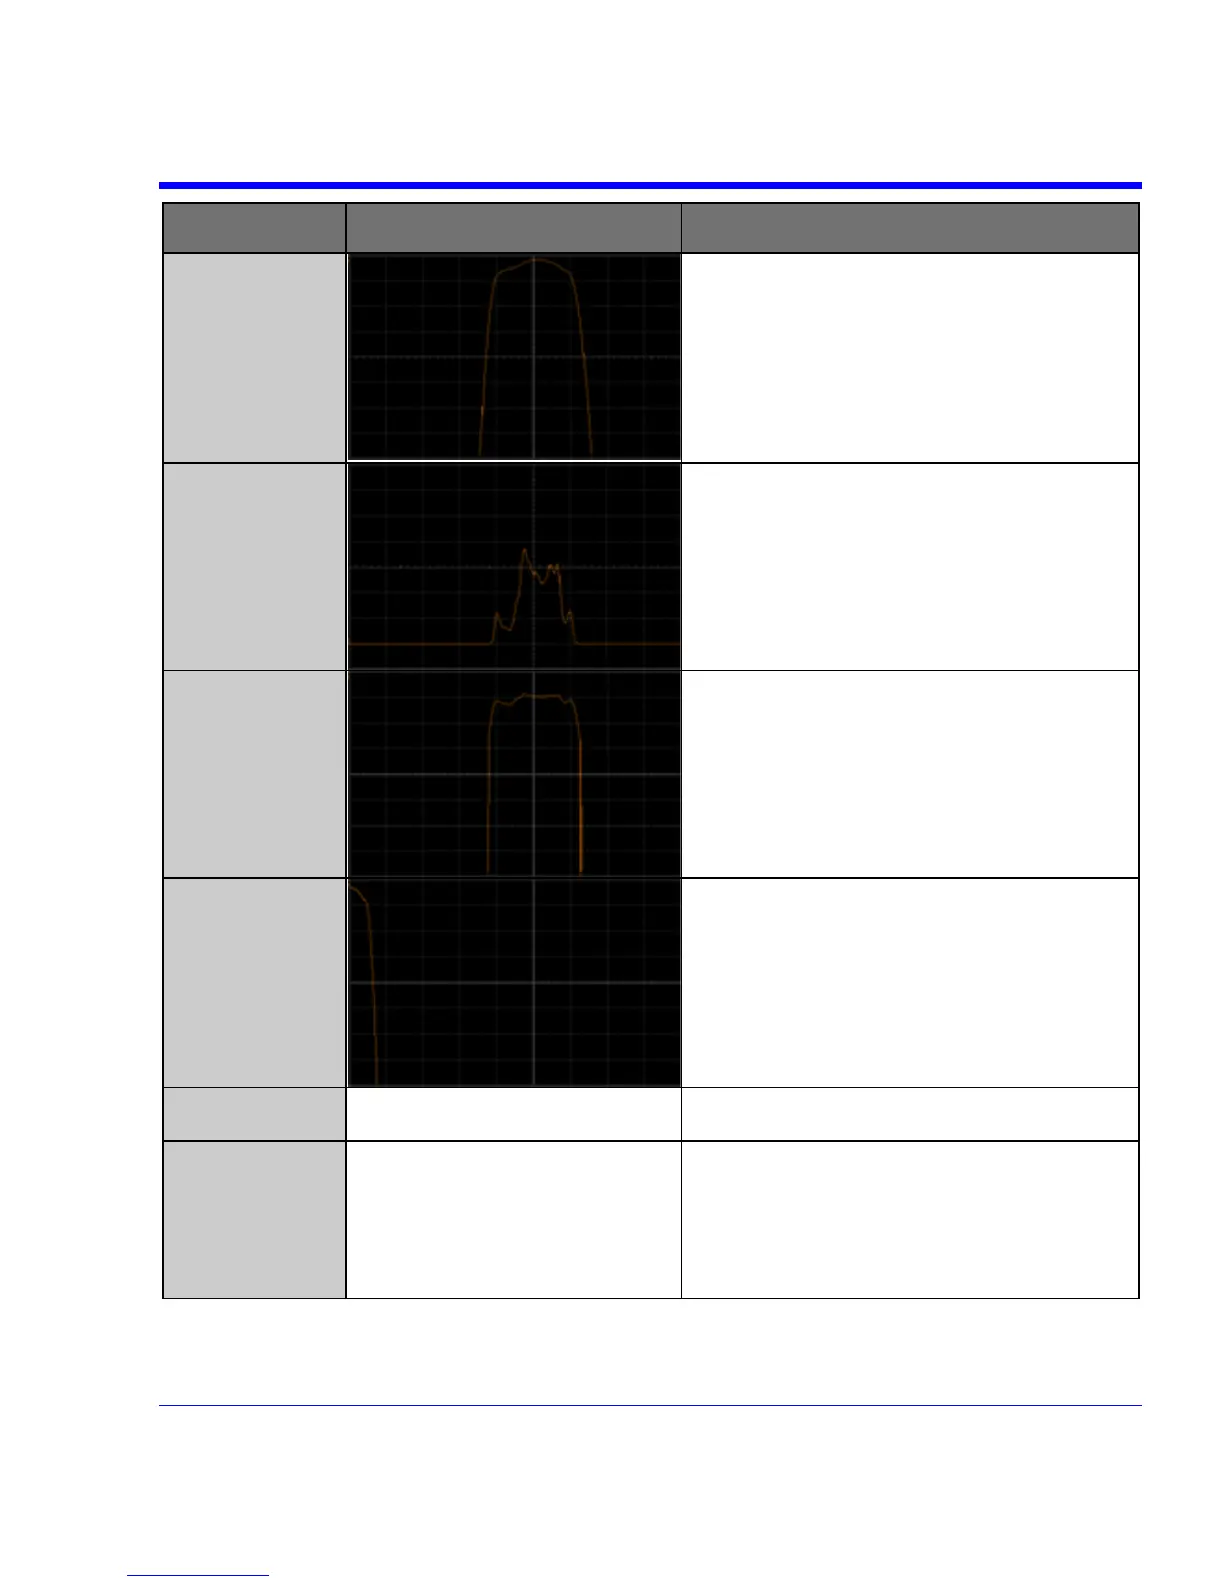
Total Jitter The total jitter curve which, shows the
cumulative probability of an edge being
greater (right-hand side) or less (left-hand
side) than its nominal location in the center.
The total jitter at a particular bit error rate is
measured from the width of this curve at the
desired bit error rate given by the vertical
location over which the width is measured.
EstTIE Estimated tie histogram. This shows the
original histogram of TIE measurements that
has been extrapolated to a population of
10
16
.
LogTIE The log of the TIE histogram
Bathtub The bathtub curve. This is a an alternate
version of the total jitter curve scaled
horizontally to 1 UI. The right-hand side of
the curve is taken from the left-hand side of
the total jitter curve, and the left-hand side
comes from the right-hand side of the total
jitter curve.
Frequency 100 kHz to 4.5 GHz The bit rate of the signal. This control is only
active when the bathtub output is active.
Transition density 0.1 to 1.0 The transition density in the data signal.
Usually assumed to be 0.5. This represents
the number of bit transitions compared to the
total number of bits in the data stream. This
value is used to normalize the extrapolated
histogram.