SDA Operator’s Manual
AltNcycle
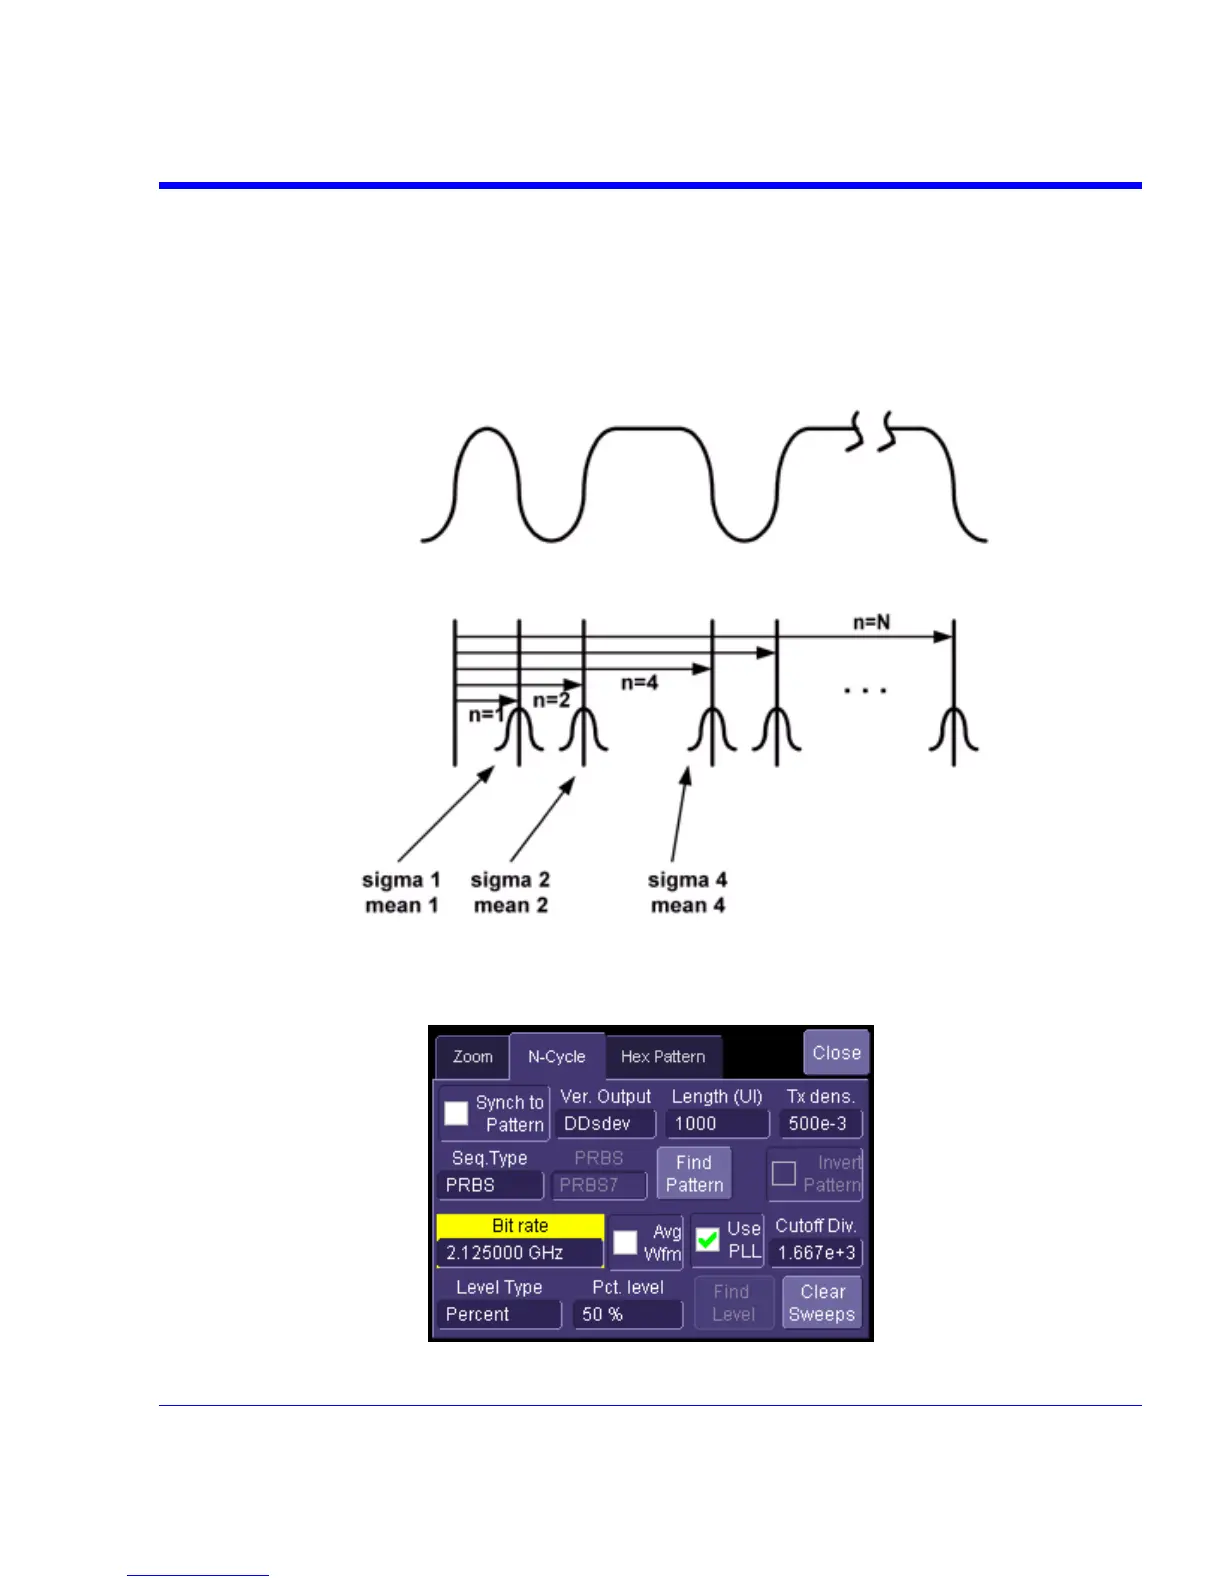
Timing of the transitions in the data waveform is measured for each transition and plotted as a
function of the number of unit intervals over which the timing is measured. The “N-Cycle” dialog is
used to control how this measurement is performed, and the diagram and table below describe
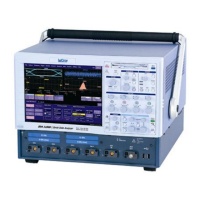
the function in detail. The N-cycle plot displays the mean or standard deviation of the edge
placement in the waveform relative to each other (data to data) or to a reference clock (clock to
data).
The N-cycle plot displays the mean or standard deviation of the distribution of timing for edges
spaced n UI apart as a function of n. The value of n can vary from 1 to some maximum value,
including all intermediate values, or can be synchronous with the transitions in a repeating
pattern.
SDA-OM-E Rev H 347